## Heatmaps: Tensor Embedding Layers
### Overview
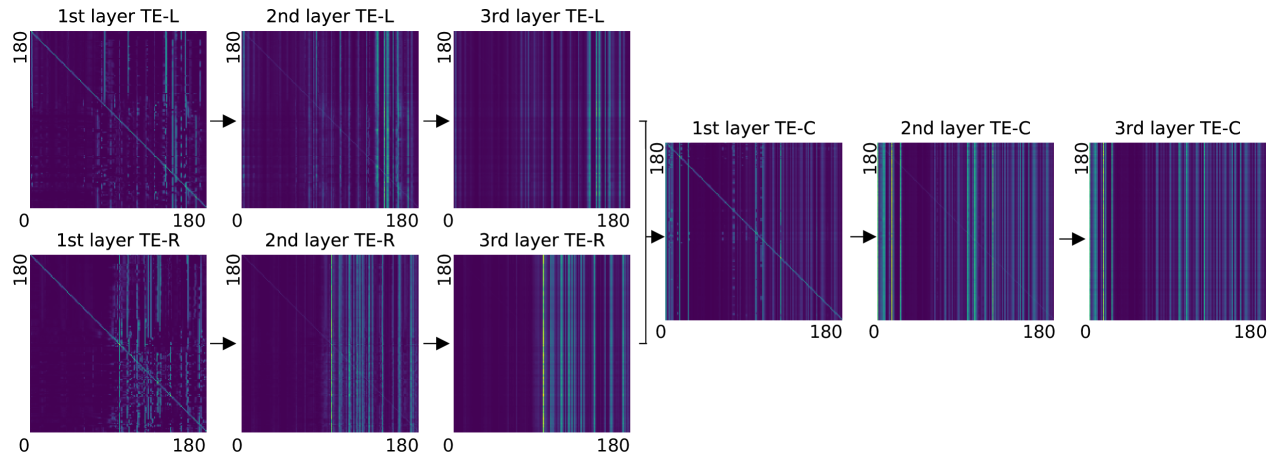
The image presents six heatmaps, arranged in a 2x3 grid. Each heatmap represents a tensor embedding (TE) layer – specifically, the 1st, 2nd, and 3rd layers – for both Left (L) and Right (R) sides, as well as a Center (C) view. The heatmaps visualize the relationships between values on a 0-180 scale for both the x and y axes. Each heatmap has a black arrow pointing to the upper-right corner.
### Components/Axes
Each heatmap shares the following components:
* **X-axis:** Labeled "0" to "180" with approximately 10 tick marks.
* **Y-axis:** Labeled "0" to "180" with approximately 10 tick marks.
* **Title:** Indicates the layer number (1st, 2nd, or 3rd) and the view (TE-L, TE-R, or TE-C).
* **Color Scale:** The heatmaps use a color gradient ranging from dark purple (low values) to bright magenta (high values). There is no explicit legend, but the color intensity represents the magnitude of the values.
### Detailed Analysis or Content Details
**1st layer TE-L:**
The heatmap shows a diagonal pattern with higher intensity (magenta) along the main diagonal. There are also several horizontal and vertical lines of varying intensity. The pattern appears somewhat chaotic, but with a clear concentration of higher values along the diagonal.
**2nd layer TE-L:**
Similar to the 1st layer, this heatmap also exhibits a diagonal pattern with higher intensity along the main diagonal. However, the pattern appears more structured and less chaotic than the 1st layer. There are more distinct horizontal and vertical lines.
**3rd layer TE-L:**
This heatmap shows a very strong diagonal pattern with a very high intensity (bright magenta) along the main diagonal. The horizontal and vertical lines are also more pronounced and structured.
**1st layer TE-R:**
This heatmap displays a similar pattern to the 1st layer TE-L, with a diagonal concentration of higher values. The pattern is also somewhat chaotic, but with a clear diagonal emphasis.
**2nd layer TE-R:**
Similar to the 2nd layer TE-L, this heatmap shows a more structured diagonal pattern with higher intensity along the main diagonal. The horizontal and vertical lines are more distinct.
**3rd layer TE-R:**
This heatmap exhibits a very strong diagonal pattern with a very high intensity along the main diagonal, similar to the 3rd layer TE-L. The horizontal and vertical lines are also more pronounced.
**1st layer TE-C:**
This heatmap shows a pattern of vertical lines with varying intensity. The diagonal pattern is less prominent compared to the TE-L and TE-R views.
**2nd layer TE-C:**
This heatmap displays a pattern of vertical lines with varying intensity. The lines appear more distinct and structured than in the 1st layer TE-C.
**3rd layer TE-C:**
This heatmap shows a pattern of vertical lines with varying intensity. The lines are very distinct and structured, with a clear separation between them.
### Key Observations
* **Diagonal Dominance (TE-L & TE-R):** The TE-L and TE-R views consistently show a strong diagonal pattern, indicating a correlation between values along the main diagonal.
* **Layer Progression:** As the layer number increases (1st to 3rd), the diagonal pattern becomes more pronounced and structured in the TE-L and TE-R views.
* **Vertical Lines (TE-C):** The TE-C view consistently displays a pattern of vertical lines, suggesting a different type of relationship between values.
* **Arrow Placement:** The black arrows in each heatmap consistently point to the upper-right corner, potentially indicating a direction of increasing values or a specific feature of the embedding.
### Interpretation
The heatmaps likely represent the output of a tensor embedding process, possibly within a neural network or machine learning model. The different views (L, R, C) could correspond to different aspects or perspectives of the embedded data.
The strong diagonal patterns in the TE-L and TE-R views suggest that the embedding process is capturing correlations between features or elements along the main diagonal. The increasing structure and intensity of the diagonal pattern as the layer number increases indicate that the embedding is becoming more refined and focused on these correlations.
The vertical line patterns in the TE-C view suggest a different type of relationship, possibly representing distinct categories or features. The increasing structure of the vertical lines as the layer number increases indicates that the embedding is becoming more capable of distinguishing between these categories.
The arrows pointing to the upper-right corner could indicate that higher values represent a specific feature or characteristic of the embedded data.
Overall, the heatmaps demonstrate a complex and structured embedding process that is capturing different types of relationships between values. The different views and layer numbers provide insights into the evolution and refinement of the embedding.