## Scatter Plot: Accuracy vs. EAcc
### Overview
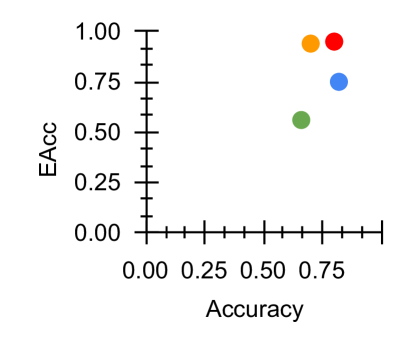
The image is a scatter plot comparing two performance metrics: "Accuracy" on the horizontal axis and "EAcc" on the vertical axis. The plot contains four distinct data points, each represented by a colored circle. There is no explicit legend provided within the image to identify what each color represents. The overall visual suggests a comparison of four different models, systems, or experimental conditions.
### Components/Axes
* **X-Axis (Horizontal):**
* **Label:** "Accuracy"
* **Scale:** Linear, ranging from 0.00 to 1.00.
* **Major Tick Marks:** At 0.00, 0.25, 0.50, 0.75, and 1.00 (implied by the axis line extending to the right edge).
* **Minor Tick Marks:** There are three minor tick marks between each major tick, dividing each 0.25 interval into four 0.0625 segments.
* **Y-Axis (Vertical):**
* **Label:** "EAcc"
* **Scale:** Linear, ranging from 0.00 to 1.00.
* **Major Tick Marks:** At 0.00, 0.25, 0.50, 0.75, and 1.00.
* **Minor Tick Marks:** Similar to the x-axis, with three minor ticks between each major tick.
* **Data Points (Circles):**
* **Orange Circle:** Located in the top-right quadrant.
* **Red Circle:** Located in the top-right quadrant, slightly to the right of the orange circle.
* **Blue Circle:** Located in the top-right quadrant, below the red circle.
* **Green Circle:** Located in the center-right area, below the blue circle.
### Detailed Analysis
**Data Point Coordinates (Approximate):**
Based on visual alignment with the axis tick marks:
1. **Orange Point:**
* **Accuracy (X):** ~0.75
* **EAcc (Y):** ~0.95
2. **Red Point:**
* **Accuracy (X):** ~0.85
* **EAcc (Y):** ~0.95
3. **Blue Point:**
* **Accuracy (X):** ~0.85
* **EAcc (Y):** ~0.75
4. **Green Point:**
* **Accuracy (X):** ~0.65
* **EAcc (Y):** ~0.55
**Spatial Grounding & Trend Verification:**
* The **Orange** and **Red** points are clustered at the highest EAcc level (~0.95). The Red point has a higher Accuracy value than the Orange point.
* The **Blue** point shares a similar high Accuracy value with the Red point (~0.85) but has a notably lower EAcc (~0.75).
* The **Green** point is the outlier, positioned with the lowest values for both Accuracy (~0.65) and EAcc (~0.55).
* There is no line connecting the points, so a continuous trend cannot be established. However, the distribution shows that three of the four points (Orange, Red, Blue) achieve high Accuracy (>0.75), while EAcc varies more significantly among them.
### Key Observations
1. **High-Performance Cluster:** Three data points (Orange, Red, Blue) are located in the region of high Accuracy (≥0.75).
2. **EAcc Variance at High Accuracy:** Among the high-accuracy points, EAcc shows a significant drop from the Orange/Red cluster (~0.95) to the Blue point (~0.75).
3. **Outlier:** The Green point is distinctly separated from the others, performing worse on both metrics.
4. **Missing Legend:** The image lacks a legend to define what the four colors (Orange, Red, Blue, Green) correspond to. This is a critical piece of information for full interpretation.
### Interpretation
This scatter plot likely compares the performance of four different entities (e.g., machine learning models, algorithms, or experimental setups) on two related but distinct metrics: standard "Accuracy" and a metric abbreviated as "EAcc" (which could stand for Expected Accuracy, Ensemble Accuracy, or another domain-specific variant).
The data suggests that achieving high standard Accuracy does not guarantee a high EAcc score, as demonstrated by the Blue point. The Orange and Red points represent the best-performing entities, excelling in both metrics. The Green point represents a clearly inferior performer.
The most significant finding is the **divergence between Accuracy and EAcc for the Blue entity**. This indicates that the two metrics are not perfectly correlated and capture different aspects of performance. An investigation would be needed to understand why the Blue entity's EAcc is lower despite its high Accuracy—perhaps it is less robust, has higher variance, or performs poorly on a specific subset of data that the EAcc metric is sensitive to.
**Without a legend, the specific identities of the four colored points remain unknown, limiting the actionable insight from the chart.** To fully utilize this data, one would need the accompanying key that maps colors to model names, configurations, or other categorical variables.