## Line Chart: Cost per Sequence vs. Number of Items per Sequence
### Overview
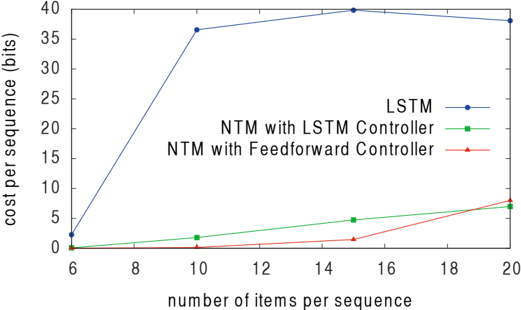
The image is a line chart comparing the cost per sequence (in bits) for three different models: LSTM, NTM with LSTM Controller, and NTM with Feedforward Controller, as the number of items per sequence increases. The x-axis represents the number of items per sequence, ranging from 6 to 20. The y-axis represents the cost per sequence in bits, ranging from 0 to 40.
### Components/Axes
* **X-axis:** "number of items per sequence" with markers at 6, 8, 10, 12, 14, 16, 18, and 20.
* **Y-axis:** "cost per sequence (bits)" with markers at 0, 5, 10, 15, 20, 25, 30, 35, and 40.
* **Legend:** Located on the right side of the chart, it identifies the three models:
* Blue line with circle markers: LSTM
* Green line with square markers: NTM with LSTM Controller
* Red line with triangle markers: NTM with Feedforward Controller
### Detailed Analysis
* **LSTM (Blue):** The cost per sequence increases sharply from approximately 2 bits at 6 items to approximately 36 bits at 10 items. From 10 items to 14 items, the cost increases slightly to approximately 39 bits, and then plateaus, remaining around 39 bits at 20 items.
* (6, ~2)
* (10, ~36)
* (14, ~39)
* (20, ~39)
* **NTM with LSTM Controller (Green):** The cost per sequence starts near 0 bits at 6 items and increases gradually to approximately 2 bits at 10 items, approximately 4.5 bits at 14 items, and approximately 7 bits at 20 items.
* (6, ~0)
* (10, ~2)
* (14, ~4.5)
* (20, ~7)
* **NTM with Feedforward Controller (Red):** The cost per sequence starts near 0 bits at 6 items and increases gradually to approximately 0.5 bits at 10 items, approximately 1 bit at 14 items, and approximately 7.5 bits at 20 items.
* (6, ~0)
* (10, ~0.5)
* (14, ~1)
* (20, ~7.5)
### Key Observations
* The LSTM model has a significantly higher cost per sequence compared to the two NTM models, especially for sequences with 10 or more items.
* The cost per sequence for the LSTM model increases rapidly initially and then plateaus.
* The cost per sequence for both NTM models increases gradually and almost linearly with the number of items per sequence.
* The NTM with Feedforward Controller has a slightly lower cost than the NTM with LSTM Controller until the number of items reaches 20, where they are approximately equal.
### Interpretation
The chart demonstrates that the LSTM model is more expensive in terms of cost per sequence (bits) than the NTM models, particularly as the sequence length increases. This suggests that for longer sequences, the NTM models with either LSTM or Feedforward controllers are more efficient. The initial sharp increase in cost for the LSTM model indicates a higher overhead or complexity in processing the initial items of the sequence. The plateauing of the LSTM cost suggests a saturation point where adding more items does not significantly increase the cost. The gradual increase in cost for the NTM models indicates a more linear relationship between sequence length and cost. The similar performance of the two NTM models suggests that the choice of controller (LSTM or Feedforward) has a relatively minor impact on the cost per sequence.