## Line Chart: Cost per Sequence vs. Sequence Number
### Overview
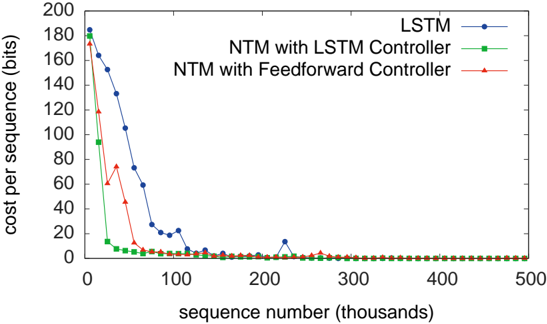
The image is a line chart comparing the cost per sequence (in bits) for three different models: LSTM, NTM with LSTM Controller, and NTM with Feedforward Controller, as a function of the sequence number (in thousands). The chart shows how the cost decreases as the sequence number increases, indicating learning or optimization over time.
### Components/Axes
* **X-axis:** Sequence number (thousands). The axis ranges from 0 to 500, with tick marks at intervals of 100.
* **Y-axis:** Cost per sequence (bits). The axis ranges from 0 to 200, with tick marks at intervals of 20.
* **Legend (top-right):**
* Blue line with circle markers: LSTM
* Green line with square markers: NTM with LSTM Controller
* Red line with triangle markers: NTM with Feedforward Controller
### Detailed Analysis
* **LSTM (Blue):** The LSTM line starts at approximately 185 bits and rapidly decreases to around 20 bits by a sequence number of 100 (thousands). It then continues to decrease, but at a slower rate, reaching a cost of approximately 2 bits by a sequence number of 300 (thousands), and remains relatively constant thereafter.
* (0, 185)
* (20, 130)
* (40, 105)
* (60, 75)
* (80, 22)
* (100, 18)
* (220, 10)
* (300, 2)
* (500, 1)
* **NTM with LSTM Controller (Green):** The NTM with LSTM Controller line starts at approximately 180 bits and decreases very rapidly to below 5 bits by a sequence number of 50 (thousands). It then remains relatively constant at around 1-2 bits for the rest of the sequence numbers.
* (0, 180)
* (20, 10)
* (40, 3)
* (60, 2)
* (500, 1)
* **NTM with Feedforward Controller (Red):** The NTM with Feedforward Controller line starts at approximately 130 bits and decreases rapidly to around 5 bits by a sequence number of 75 (thousands). It then remains relatively constant at around 1-2 bits for the rest of the sequence numbers.
* (0, 130)
* (20, 60)
* (40, 75)
* (60, 50)
* (80, 3)
* (500, 1)
### Key Observations
* All three models show a significant decrease in cost per sequence as the sequence number increases, indicating learning.
* The NTM with LSTM Controller and NTM with Feedforward Controller models converge to a low cost much faster than the LSTM model.
* After an initial rapid decrease, the cost for all models stabilizes at a low level (around 1-2 bits).
* The LSTM model has a slower initial learning rate compared to the other two models.
### Interpretation
The data suggests that the NTM models, especially those with LSTM or Feedforward controllers, are more efficient in reducing the cost per sequence compared to the standalone LSTM model. This could be due to the memory capabilities of the NTM architecture, which allows it to learn and generalize more effectively from the sequences. The rapid convergence of the NTM models indicates that they can quickly adapt to the task and achieve a low cost, while the LSTM model requires more training sequences to reach a similar level of performance. The stabilization of the cost at a low level for all models suggests that they eventually reach a point where further learning provides minimal improvement in cost reduction.