## Line Graph: Cost per Sequence vs. Sequence Number (Thousands)
### Overview
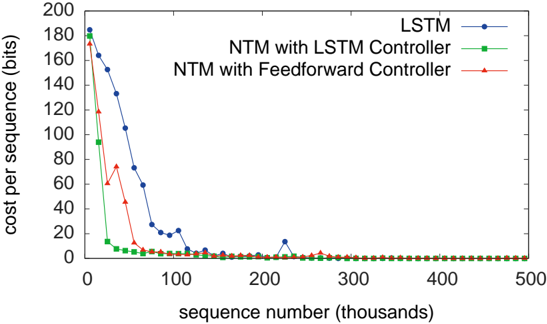
The image is a line graph comparing the cost per sequence (in bits) across three methods: LSTM, NTM with LSTM Controller, and NTM with Feedforward Controller. The x-axis represents sequence numbers (in thousands), and the y-axis represents cost per sequence (in bits). All three lines exhibit a sharp decline in cost initially, followed by stabilization at low values.
### Components/Axes
- **X-axis**: "sequence number (thousands)" (ranges from 0 to 500,000 in increments of 100,000).
- **Y-axis**: "cost per sequence (bits)" (ranges from 0 to 200 in increments of 20).
- **Legend**: Located at the top-right corner, with three entries:
- **Blue line with circles**: LSTM
- **Green line with squares**: NTM with LSTM Controller
- **Red line with triangles**: NTM with Feedforward Controller
### Detailed Analysis
1. **LSTM (Blue Line)**:
- Starts at ~180 bits at sequence 0.
- Drops sharply to ~20 bits by sequence 100,000.
- Exhibits a minor spike (~15 bits) at sequence 200,000 before stabilizing near 0 bits.
2. **NTM with LSTM Controller (Green Line)**:
- Begins at ~160 bits at sequence 0.
- Declines steeply to ~10 bits by sequence 50,000.
- Remains near 0 bits for sequences ≥50,000.
3. **NTM with Feedforward Controller (Red Line)**:
- Starts at ~140 bits at sequence 0.
- Decreases gradually to ~5 bits by sequence 100,000.
- Stabilizes near 0 bits for sequences ≥100,000.
### Key Observations
- All three methods show a **sharp initial decline** in cost, followed by **near-zero stabilization**.
- **LSTM** has the highest initial cost but the steepest drop.
- **NTM with Feedforward Controller** starts with the lowest cost and decreases more gradually.
- A minor outlier in the LSTM line at sequence 200,000 (~15 bits) does not disrupt the overall trend.
### Interpretation
The graph demonstrates that all three methods become highly efficient (near-zero cost) as sequence numbers increase. However, **NTM with Feedforward Controller** is the most cost-effective from the start, while **LSTM** requires the largest initial computational resources. The spike in LSTM at sequence 200,000 may indicate a temporary inefficiency or anomaly in that specific data point. The stabilization at low costs suggests that all methods achieve optimal performance for large sequence numbers, but their initial resource demands differ significantly.