## Heatmap: Layer-Token Activation Pattern
### Overview
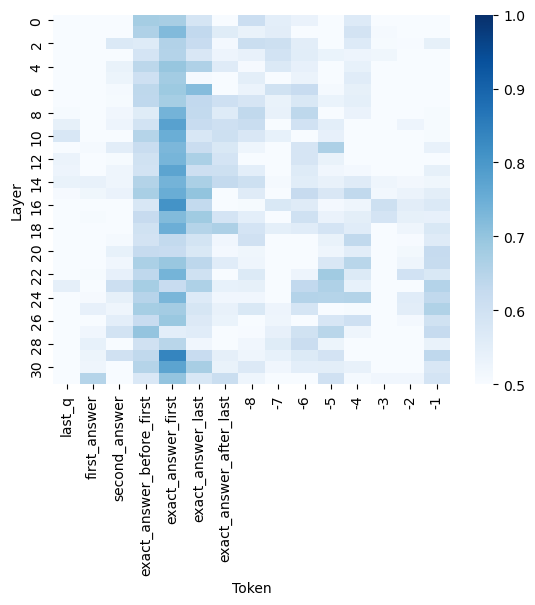
The image is a heatmap visualization depicting numerical values (likely activation strengths, attention scores, or correlation coefficients) across a grid defined by neural network layers (Y-axis) and specific tokens (X-axis). The color intensity represents the magnitude of the value, with a scale provided on the right.
### Components/Axes
* **Y-Axis (Vertical):** Labeled **"Layer"**. It is a linear scale with major tick marks at intervals of 2, ranging from **0 at the top to 30 at the bottom**. The layers are numbered sequentially: 0, 2, 4, 6, 8, 10, 12, 14, 16, 18, 20, 22, 24, 26, 28, 30.
* **X-Axis (Horizontal):** Labeled **"Token"**. It contains categorical labels for specific tokens or token positions. Reading from left to right, the labels are:
1. `last_q`
2. `first_answer`
3. `second_answer`
4. `exact_answer_before_first`
5. `exact_answer_first`
6. `exact_answer_last`
7. `exact_answer_after_last`
8. `-8`
9. `-7`
10. `-6`
11. `-5`
12. `-4`
13. `-3`
14. `-2`
15. `-1`
* **Color Bar (Legend):** Positioned vertically on the **right side** of the chart. It provides a scale for interpreting the cell colors.
* **Label:** None explicit, but the scale implies a value range.
* **Range:** **0.5 (lightest blue/white) to 1.0 (darkest blue)**.
* **Gradient:** A continuous blue gradient, where darker blue corresponds to higher values.
### Detailed Analysis
The heatmap is a 16 (Layers) x 15 (Tokens) grid. Each cell's color corresponds to a value between approximately 0.5 and 1.0.
**Trend Verification & Spatial Analysis:**
* **General Pattern:** The highest values (darkest blue cells, ~0.9-1.0) are not uniformly distributed. They form a distinct vertical band in the middle-left section of the chart.
* **High-Value Columns:** The columns for tokens **`exact_answer_before_first`** and **`exact_answer_first`** show the most intense and consistent dark blue coloring, particularly from **Layer 8 down to Layer 16**. This indicates these tokens have very high associated values in the mid-layers of the network.
* **High-Value Rows:** The layers showing the most intense activity are concentrated between **Layer 8 and Layer 16**. Within this band, the darkest cells are in the `exact_answer_first` column.
* **Lower-Value Areas:** The top rows (Layers 0-6) and bottom rows (Layers 20-30) generally show lighter colors (values closer to 0.5-0.7), with some exceptions. The rightmost columns (tokens `-8` through `-1`) also show predominantly lighter colors, indicating lower values for these positional tokens.
* **Specific Observations:**
* The token **`exact_answer_first`** at **Layer 14** appears to be one of the darkest cells in the entire map, suggesting a peak value near 1.0.
* The token **`last_q`** shows moderate values (medium blue) in the early layers (0-4) but fades to lighter shades in deeper layers.
* The token **`exact_answer_after_last`** shows a notable pocket of medium-high values (medium blue) around **Layers 22-26**.
### Key Observations
1. **Mid-Layer Focus:** The network's processing, as measured by this metric, is most intense in the middle layers (8-16) for specific answer-related tokens.
2. **Token Specificity:** There is a strong differentiation between token types. Tokens directly referencing the "exact answer" (`exact_answer_before_first`, `exact_answer_first`) elicit much stronger responses than general positional tokens (`-8` to `-1`) or question/other answer tokens (`last_q`, `first_answer`).
3. **Spatial Clustering:** High values are not random; they cluster in a specific region of the layer-token space, suggesting a localized computational focus.
### Interpretation
This heatmap likely visualizes the internal state (e.g., attention weights or neuron activations) of a language model during a task involving question answering and answer extraction. The data suggests the model's "focus" or processing strength is not evenly distributed.
* **What it demonstrates:** The model appears to dedicate significant computational resources in its middle layers to precisely locating and processing the beginning of the exact answer span (`exact_answer_before_first`, `exact_answer_first`). This is a critical step for tasks like extractive question answering.
* **Relationship between elements:** The Y-axis (Layer) represents depth of processing, and the X-axis (Token) represents the input sequence. The pattern shows that deep, mid-level processing is specialized for answer-critical tokens, while shallower and deeper layers, as well as non-critical tokens, are less engaged by this particular metric.
* **Notable patterns/anomalies:** The sharp drop-off in value for tokens `-8` to `-1` is notable. These likely represent tokens at negative positions relative to some anchor (e.g., the end of the answer). Their low values suggest the model's mechanism being measured here is not strongly engaged by these trailing positional markers. The secondary cluster for `exact_answer_after_last` in layers 22-26 might indicate a separate, later-stage process for verifying or contextualizing the answer's end.