## Bar Chart: Prediction Flip Rate Comparison for Llama-3 Models
### Overview
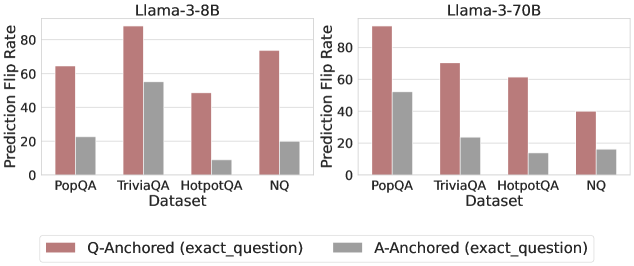
The image presents two bar charts comparing the prediction flip rates of two language models, Llama-3-8B and Llama-3-70B, across four different datasets: PopQA, TriviaQA, HotpotQA, and NQ. The charts compare the flip rates when the question is anchored to the question itself (Q-Anchored) versus when it's anchored to the answer (A-Anchored).
### Components/Axes
* **Titles:**
* Left Chart: Llama-3-8B
* Right Chart: Llama-3-70B
* **Y-Axis:** Prediction Flip Rate (ranging from 0 to 80, with tick marks at 20, 40, 60, and 80)
* **X-Axis:** Dataset (categorical): PopQA, TriviaQA, HotpotQA, NQ
* **Legend:** Located at the bottom of the image.
* Q-Anchored (exact\_question): Represented by a light brown/reddish bar.
* A-Anchored (exact\_question): Represented by a gray bar.
### Detailed Analysis
**Llama-3-8B (Left Chart):**
* **PopQA:**
* Q-Anchored: Approximately 64
* A-Anchored: Approximately 22
* **TriviaQA:**
* Q-Anchored: Approximately 87
* A-Anchored: Approximately 55
* **HotpotQA:**
* Q-Anchored: Approximately 49
* A-Anchored: Approximately 9
* **NQ:**
* Q-Anchored: Approximately 73
* A-Anchored: Approximately 19
**Llama-3-70B (Right Chart):**
* **PopQA:**
* Q-Anchored: Approximately 95
* A-Anchored: Approximately 52
* **TriviaQA:**
* Q-Anchored: Approximately 70
* A-Anchored: Approximately 23
* **HotpotQA:**
* Q-Anchored: Approximately 63
* A-Anchored: Approximately 12
* **NQ:**
* Q-Anchored: Approximately 40
* A-Anchored: Approximately 16
### Key Observations
* For both models and across all datasets, the Q-Anchored flip rate is consistently higher than the A-Anchored flip rate.
* Llama-3-70B generally exhibits higher prediction flip rates compared to Llama-3-8B, especially for PopQA.
* TriviaQA shows the highest Q-Anchored flip rate for Llama-3-8B, while PopQA shows the highest Q-Anchored flip rate for Llama-3-70B.
* HotpotQA consistently has the lowest A-Anchored flip rates for both models.
### Interpretation
The data suggests that anchoring the question to the question itself (Q-Anchored) leads to a higher prediction flip rate compared to anchoring it to the answer (A-Anchored). This could indicate that the models are more sensitive to variations or perturbations in the question itself. The larger Llama-3-70B model generally shows higher flip rates, potentially indicating a greater sensitivity or complexity in its decision-making process. The differences in flip rates across datasets suggest that the models' robustness varies depending on the type of questions being asked. The lower A-Anchored flip rates for HotpotQA might indicate that the model is more confident or stable in its predictions for this particular dataset when the answer is the anchor.