## Scatter Plots & Correlation Matrix: Model Performance Across Datasets
### Overview
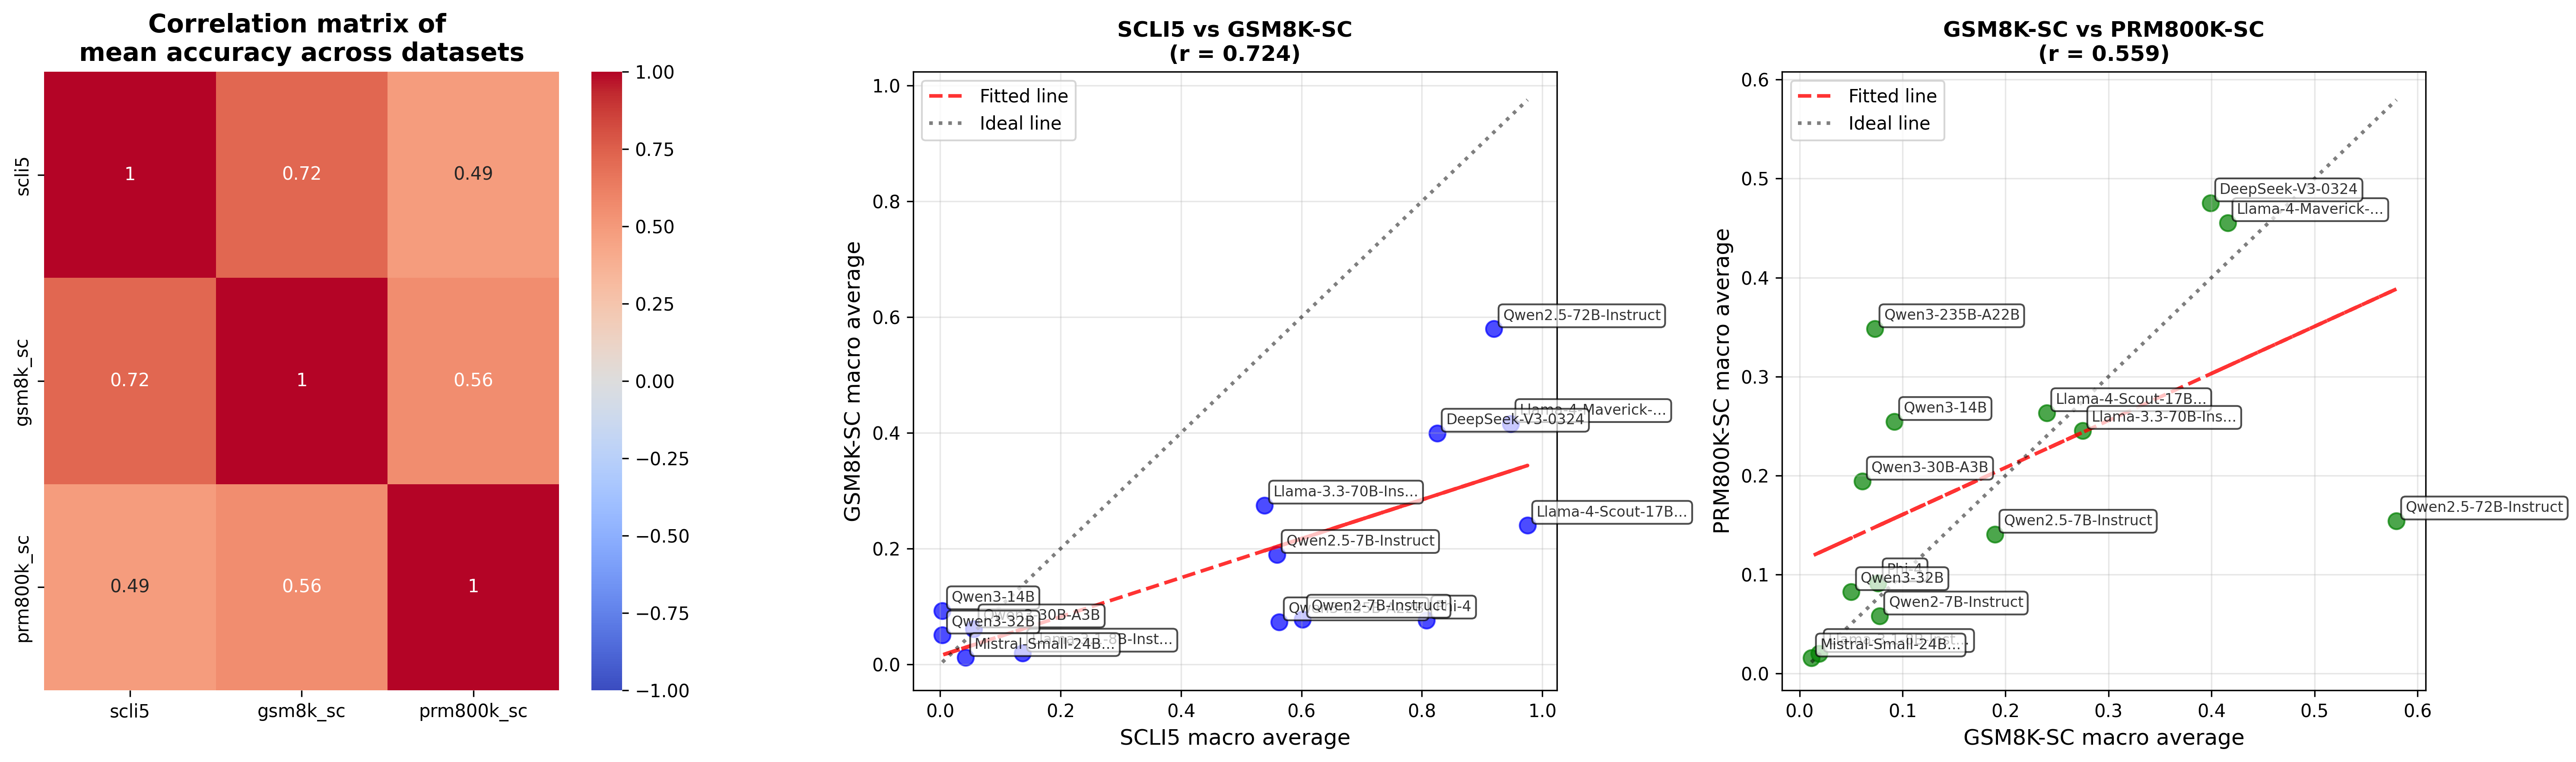
The image presents a correlation matrix alongside two scatter plots. The correlation matrix visualizes the pairwise correlations between mean accuracy scores across three datasets: SCLIS, GSM8K-SC, and PRMBOOK-SC. The scatter plots compare the performance of different models on pairs of these datasets, with fitted lines and an "ideal line" for reference.
### Components/Axes
**Correlation Matrix:**
* **Title:** "Correlation matrix of mean accuracy across datasets"
* **Labels:** SCLIS, GSM8K-SC, PRMBOOK-SC (along both axes)
* **Color Scale:** Ranges from -1.00 (dark blue) to 1.00 (dark red), representing negative to positive correlation. Values are displayed within the matrix cells.
**Scatter Plot 1 (SCLIS vs GSM8K-SC):**
* **Title:** "SCLIS vs GSM8K-SC (r = 0.724)"
* **X-axis:** SCLIS macro average (scale from approximately 0.0 to 1.0)
* **Y-axis:** GSM8K-SC macro average (scale from approximately 0.0 to 1.0)
* **Lines:**
* Fitted line (red, dashed)
* Ideal line (green, dotted)
* **Data Points:** Labeled with model names (e.g., "Owen2.5-7B-instruct", "DeepSeek-4-3224")
**Scatter Plot 2 (GSM8K-SC vs PRMBOOK-SC):**
* **Title:** "GSM8K-SC vs PRMBOOK-SC (r = 0.559)"
* **X-axis:** GSM8K-SC macro average (scale from approximately 0.0 to 0.6)
* **Y-axis:** PRMBOOK-SC macro average (scale from approximately 0.0 to 0.6)
* **Lines:**
* Fitted line (red, dashed)
* Ideal line (green, dotted)
* **Data Points:** Labeled with model names (e.g., "Owen2.5-3B", "DeepSeek-4-3224")
### Detailed Analysis or Content Details
**Correlation Matrix:**
* SCLIS vs GSM8K-SC: 0.72
* SCLIS vs PRMBOOK-SC: 0.49
* GSM8K-SC vs PRMBOOK-SC: 0.56
**Scatter Plot 1 (SCLIS vs GSM8K-SC):**
The fitted line slopes upward, indicating a positive correlation. The ideal line is a 45-degree line.
* DeepSeek-4-3224: (approximately 0.95, 0.85)
* Llama-4-Maverick: (approximately 0.90, 0.75)
* Owen2.5-72B-instruct: (approximately 0.85, 0.65)
* Llama-4-Scout-17B-ins: (approximately 0.75, 0.55)
* Owen2.5-7B-instruct: (approximately 0.70, 0.45)
* Owen2.3-32B: (approximately 0.60, 0.35)
* Mistral-Small-7B-ins: (approximately 0.50, 0.25)
**Scatter Plot 2 (GSM8K-SC vs PRMBOOK-SC):**
The fitted line also slopes upward, indicating a positive correlation, but less strong than the first scatter plot.
* DeepSeek-4-3224: (approximately 0.55, 0.50)
* Llama-4-Maverick: (approximately 0.50, 0.40)
* Owen2.5-3B: (approximately 0.40, 0.15)
* Owen2.5-72B-instruct: (approximately 0.35, 0.25)
* Llama-4-Scout-17B-ins: (approximately 0.30, 0.20)
* Owen2.3-32B: (approximately 0.25, 0.10)
* Mistral-Small-7B-ins: (approximately 0.20, 0.05)
### Key Observations
* The correlation between SCLIS and GSM8K-SC is the strongest (0.72), suggesting that models performing well on one dataset tend to perform well on the other.
* The correlation between GSM8K-SC and PRMBOOK-SC is moderate (0.56).
* DeepSeek-4-3224 consistently shows high performance across all datasets.
* Mistral-Small-7B-ins consistently shows lower performance across all datasets.
* The scatter plots show that the fitted lines do not perfectly align with the ideal line, indicating that performance on one dataset does not perfectly predict performance on the other.
### Interpretation
The data suggests that there is a degree of transferability in model performance across these datasets, but it is not perfect. Models that excel in one area (e.g., SCLIS) generally perform well in related areas (e.g., GSM8K-SC), but there are exceptions. The correlation matrix quantifies this relationship, while the scatter plots provide a more granular view of individual model performance.
The "ideal line" in the scatter plots represents perfect correlation – if a model's performance on the x-axis perfectly predicted its performance on the y-axis, all data points would fall on this line. The deviation from this line indicates the presence of factors beyond the correlation between the two datasets that influence model performance.
The consistent high performance of DeepSeek-4-3224 and lower performance of Mistral-Small-7B-ins suggest that model architecture and/or training data play a significant role in determining performance on these tasks. The differences in the slopes of the fitted lines in the two scatter plots indicate that the relationship between GSM8K-SC and PRMBOOK-SC is different than the relationship between SCLIS and GSM8K-SC. This could be due to differences in the nature of the tasks or the data distributions within each dataset.