## 3D Diagram: Hierarchical Pyramid of Cubes
### Overview
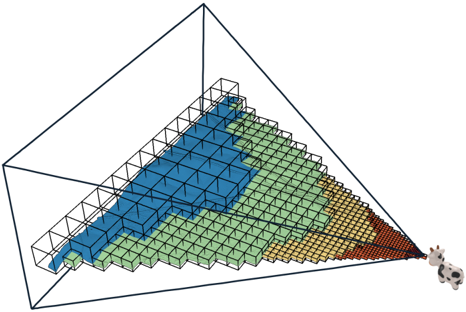
The image displays a three-dimensional, wireframe tetrahedron (a triangular pyramid) containing a structured arrangement of smaller, colored cubes. The cubes are organized in layers that follow the pyramid's geometry, decreasing in size and increasing in number from the top vertex to the base. A small icon of a person or robot with a camera is positioned at the bottom-right vertex of the pyramid, appearing to observe or interact with the structure. There are **no textual labels, axis titles, legends, or numerical markers** present in the image. The information is conveyed entirely through visual geometry, color, and spatial relationships.
### Components/Axes
* **Primary Structure:** A wireframe tetrahedron (pyramid with a triangular base) outlined in dark blue/black lines. It defines the spatial boundary.
* **Internal Components:** A grid of small, solid-colored cubes arranged in a hierarchical, layered pattern that conforms to the pyramid's shape.
* **Color Palette:** Four distinct colors are used for the cubes, arranged in contiguous regions:
* **Blue:** Occupies the top-most layers.
* **Green:** Forms a middle layer beneath the blue.
* **Yellow/Orange:** Forms a lower layer beneath the green.
* **Red:** Occupies the lowest, most numerous layers at the base.
* **Observer Icon:** A small, monochromatic (grey/white) icon of a figure (possibly a robot or person with a camera) is placed at the bottom-right corner vertex of the pyramid's wireframe, oriented towards the interior cube structure.
### Detailed Analysis
* **Spatial Arrangement & Flow:** The cubes are arranged in a strict, grid-like pattern that follows the pyramid's faces. The structure suggests a top-down hierarchy or a process flow from the apex (blue) to the base (red).
* **Cube Size & Quantity Trend:** There is a clear inverse relationship between vertical position and cube size/quantity.
* **Top (Blue Region):** Contains the largest individual cubes. They are fewest in number, forming a sparse, coarse grid.
* **Middle (Green Region):** Cubes are smaller than the blue ones and more numerous, forming a denser grid.
* **Lower (Yellow/Orange Region):** Cubes are smaller still and more numerous than the green layer.
* **Base (Red Region):** Contains the smallest individual cubes. They are the most numerous, forming a very fine, dense grid at the bottom of the pyramid.
* **Color Gradient Logic:** The color progression from cool (blue) at the top to warm (red) at the bottom is a common visual metaphor for a gradient of intensity, priority, temperature, or stage in a process (e.g., from abstract to concrete, from input to output, from low to high density).
### Key Observations
1. **No Textual Data:** The diagram is purely conceptual and contains zero alphanumeric information. All meaning must be inferred from visual encoding.
2. **Perfect Geometric Alignment:** Every cube is perfectly aligned within the 3D grid defined by the pyramid's wireframe, indicating a highly structured, systematic model.
3. **Discrete Color Regions:** The colors are not blended; they form distinct, contiguous blocks. This suggests categorical separation rather than a continuous spectrum.
4. **Observer Placement:** The icon's position at a vertex, looking inward, implies it is either the source of the data (input) or the consumer/analyst of the structure (output).
### Interpretation
This diagram is an abstract visualization of a **hierarchical or multi-resolution data model**. The pyramid shape is a classic metaphor for structures where a broad base supports a narrow top.
* **What it Suggests:** The model likely represents a system where information or entities are processed, filtered, or aggregated as they move from the base to the apex.
* The **red base** could represent raw, high-volume, low-level data or individual components.
* The **yellow and green layers** represent intermediate stages of processing, grouping, or abstraction.
* The **blue apex** represents the most refined, aggregated, or high-level output/conclusion.
* **Relationships:** The flow is implicitly vertical. The observer icon at the base-right vertex is intriguing. It could symbolize:
* The **entry point** for data collection (observing the raw, red-level details).
* The **vantage point** for analysis, looking up through the layers of abstraction.
* An **agent** interacting with the system at its most concrete level.
* **Anomalies & Abstraction:** The primary "anomaly" is the complete lack of labels, which makes the diagram universally applicable but non-specific. It is a template for thinking about hierarchical systems (e.g., neural network layers, organizational structures, information retrieval pyramids, or multi-scale simulation models) rather than a presentation of specific data. The precision of the cube grid implies a digital, computational, or highly systematized context.