## Diagram: State Transition and Grid Layout System
### Overview
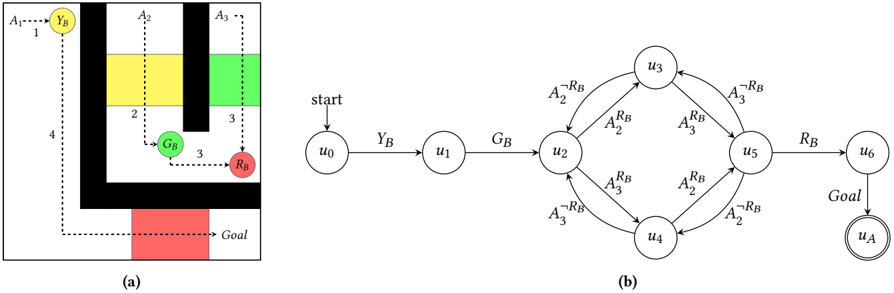
The image contains two interconnected components:
1. **(a) Grid Layout**: A spatial representation with labeled zones, colored regions, and directional connections.
2. **(b) State Transition Diagram**: A flowchart depicting a process flow with nodes, transitions, and goal states.
---
### Components/Axes
#### (a) Grid Layout
- **Labels**:
- `A1`, `A2`, `A3`: Vertical/horizontal axis labels (left and top edges).
- `Y_B`, `G_B`, `R_B`: Node labels within the grid.
- `Goal`: Terminal state at the bottom-right.
- **Colors**:
- Yellow (`A1` zone), Green (`A2` zone), Black (obstacle), Red (`Goal`).
- **Connections**:
- Dotted lines indicate transitions between nodes (e.g., `Y_B` → `G_B` → `R_B`).
- **Spatial Grounding**:
- `Y_B` is positioned at the top-left corner.
- `Goal` is anchored at the bottom-right.
- Obstacles (black) block direct paths between zones.
#### (b) State Transition Diagram
- **Nodes**:
- `u0` (start), `u1`, `u2`, `u3`, `u4`, `u5`, `u6` (goal), `u_A` (alternate goal).
- **Transitions**:
- Labeled with actions/states: `A2^RB`, `A3^RB`, `A2^RB`, `A3^RB`, `R_B`.
- Arrows indicate directionality (e.g., `u2` → `u3` via `A2^RB`).
- **Spatial Grounding**:
- Nodes form a loop (`u3` → `u4` → `u5` → `u3`).
- `u6` (goal) is terminal; `u_A` is an alternate endpoint.
---
### Detailed Analysis
#### (a) Grid Layout
- **Zones**:
- `A1` (yellow): Top-left region, connected to `Y_B`.
- `A2` (green): Middle region, connected to `G_B`.
- `A3` (black/red): Right-side obstacle/goal region.
- **Path Constraints**:
- Obstacles (black) force indirect routing (e.g., `Y_B` → `G_B` → `R_B`).
- `Goal` is accessible only via `R_B`.
#### (b) State Transition Diagram
- **Flow Logic**:
- Start (`u0`) → `Y_B` → `u1` → `G_B` → `u2`.
- From `u2`, transitions branch to `u3`, `u4`, `u5` via `A2^RB`/`A3^RB`.
- Loop between `u3`, `u4`, `u5` using `A2^RB`/`A3^RB`.
- Exit to `u6` (goal) via `R_B` or `u_A`.
- **Key Nodes**:
- `u2`: Decision point for branching.
- `u5`: Convergence point for loop transitions.
---
### Key Observations
1. **Grid-to-Flow Correlation**:
- `Y_B`, `G_B`, `R_B` in the grid map to `u1`, `u2`, `u5` in the flowchart.
- Obstacles in the grid (`A3` black) align with constrained transitions in the flowchart.
2. **Redundancy**:
- Multiple paths to `u6` (goal) via `R_B` and `u_A`.
3. **Cyclical Behavior**:
- Loop between `u3`, `u4`, `u5` suggests iterative processing.
---
### Interpretation
This system models a **state-dependent navigation process** where spatial constraints (grid) dictate allowable transitions (flowchart).
- **Purpose**:
- The grid represents a physical or logical environment with zones and obstacles.
- The flowchart abstracts the decision-making process for navigating these zones.
- **Notable Patterns**:
- The loop (`u3`→`u4`→`u5`) implies repeated evaluation or resource allocation.
- Dual goal states (`u6` and `u_A`) suggest contingency planning.
- **Anomalies**:
- No explicit mechanism to exit the loop (`u3`→`u4`→`u5`) without reaching `u6`/`u_A`.
This dual representation bridges spatial reasoning (grid) with algorithmic logic (flowchart), emphasizing path optimization under constraints.