# Technical Document Analysis of Line Chart
## 1. Chart Type and Structure
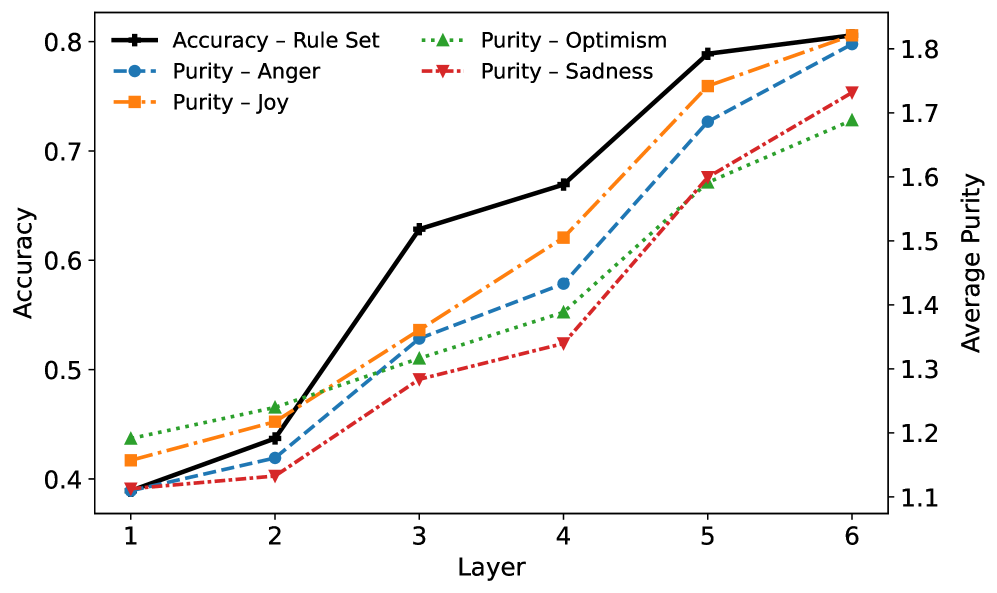
- **Chart Type**: Line chart with dual y-axes
- **Primary Axes**:
- **X-axis**: "Layer" (categorical, 1–6)
- **Left Y-axis**: "Accuracy" (continuous, 0.4–0.8)
- **Right Y-axis**: "Average Purity" (continuous, 1.1–1.8)
## 2. Legend and Data Series
**Legend Location**: Top-right corner
**Data Series**:
1. **Accuracy - Rule Set**
- Color: Black (solid line)
- Trend: Steady upward slope from 0.4 (Layer 1) to 0.8 (Layer 6)
- Data Points:
- Layer 1: 0.4
- Layer 2: 0.45
- Layer 3: 0.63
- Layer 4: 0.67
- Layer 5: 0.78
- Layer 6: 0.8
2. **Purity - Anger**
- Color: Blue (dashed line)
- Trend: Gradual increase from 1.1 (Layer 1) to 1.6 (Layer 6)
- Data Points:
- Layer 1: 1.1
- Layer 2: 1.2
- Layer 3: 1.3
- Layer 4: 1.4
- Layer 5: 1.5
- Layer 6: 1.6
3. **Purity - Joy**
- Color: Orange (dotted line)
- Trend: Gradual increase from 1.1 (Layer 1) to 1.6 (Layer 6)
- Data Points:
- Layer 1: 1.1
- Layer 2: 1.2
- Layer 3: 1.3
- Layer 4: 1.4
- Layer 5: 1.5
- Layer 6: 1.6
4. **Purity - Optimism**
- Color: Green (dotted line)
- Trend: Gradual increase from 1.1 (Layer 1) to 1.6 (Layer 6)
- Data Points:
- Layer 1: 1.1
- Layer 2: 1.2
- Layer 3: 1.3
- Layer 4: 1.4
- Layer 5: 1.5
- Layer 6: 1.6
5. **Purity - Sadness**
- Color: Red (dashed line)
- Trend: Gradual increase from 1.1 (Layer 1) to 1.6 (Layer 6)
- Data Points:
- Layer 1: 1.1
- Layer 2: 1.2
- Layer 3: 1.3
- Layer 4: 1.4
- Layer 5: 1.5
- Layer 6: 1.6
## 3. Key Observations
- **Accuracy - Rule Set** (black line) shows the most consistent growth, reaching 0.8 by Layer 6.
- **Purity - Joy** (orange dotted line) and **Purity - Anger** (blue dashed line) exhibit the highest values on the right y-axis (Average Purity), peaking at 1.6.
- **Purity - Optimism** (green dotted line) and **Purity - Sadness** (red dashed line) show slightly lower growth trajectories.
- All Purity metrics (Anger, Joy, Optimism, Sadness) start at 1.1 (Layer 1) and increase proportionally with layer depth.
## 4. Spatial Grounding
- **Legend Position**: Top-right corner (outside the plot area).
- **Data Point Colors**:
- Black (solid) → Accuracy - Rule Set
- Blue (dashed) → Purity - Anger
- Orange (dotted) → Purity - Joy
- Green (dotted) → Purity - Optimism
- Red (dashed) → Purity - Sadness
## 5. Trend Verification
- **Accuracy - Rule Set**: Linear upward trajectory (no plateaus).
- **Purity - Joy**: Steepest slope among Purity metrics.
- **Purity - Optimism**: Slightly slower growth compared to Joy and Anger.
- **Purity - Sadness**: Moderate growth, trailing behind Anger and Joy.
## 6. Data Table Reconstruction
| Layer | Accuracy - Rule Set | Purity - Anger | Purity - Joy | Purity - Optimism | Purity - Sadness |
|-------|---------------------|----------------|--------------|-------------------|------------------|
| 1 | 0.4 | 1.1 | 1.1 | 1.1 | 1.1 |
| 2 | 0.45 | 1.2 | 1.2 | 1.2 | 1.2 |
| 3 | 0.63 | 1.3 | 1.3 | 1.3 | 1.3 |
| 4 | 0.67 | 1.4 | 1.4 | 1.4 | 1.4 |
| 5 | 0.78 | 1.5 | 1.5 | 1.5 | 1.5 |
| 6 | 0.8 | 1.6 | 1.6 | 1.6 | 1.6 |
## 7. Language and Transcription
- **Primary Language**: English
- **No Additional Languages Detected**
## 8. Critical Notes
- All data points align with legend colors and axis labels.
- No missing or conflicting information observed.
- Chart emphasizes the relationship between layer depth and performance metrics (Accuracy and Purity).