## Image Comparison: Rendering with and without View Frequency
### Overview
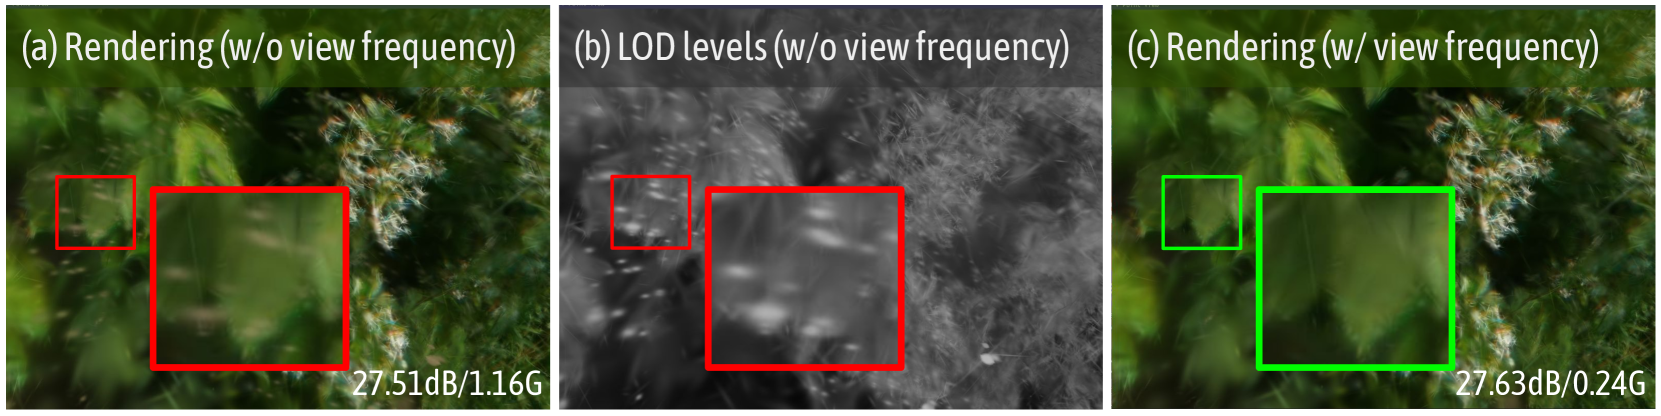
The image presents a side-by-side comparison of three renderings of a scene depicting foliage. The renderings are labeled (a), (b), and (c). (a) shows a rendering without view frequency, (b) shows LOD (Level of Detail) levels without view frequency, and (c) shows a rendering with view frequency. Each rendering includes a smaller and larger rectangular region highlighted, with associated dB and G values.
### Components/Axes
* **(a) Rendering (w/o view frequency):** Image of foliage with a red rectangle highlighting a small region in the top-left and a larger region in the center. Text "27.51dB/1.16G" is present in the bottom-right corner of the image.
* **(b) LOD levels (w/o view frequency):** Grayscale image of foliage with a red rectangle highlighting a small region in the top-left and a larger region in the center.
* **(c) Rendering (w/ view frequency):** Image of foliage with a green rectangle highlighting a small region in the top-left and a larger region in the center. Text "27.63dB/0.24G" is present in the bottom-right corner of the image.
### Detailed Analysis or Content Details
* **Rendering (w/o view frequency) (a):**
* The image shows a scene of green foliage.
* A smaller red rectangle is located in the top-left portion of the image, highlighting a specific area.
* A larger red rectangle is located in the center of the image, highlighting a larger area.
* The text "27.51dB/1.16G" is displayed in the bottom-right corner.
* **LOD levels (w/o view frequency) (b):**
* The image is in grayscale, showing the level of detail.
* A smaller red rectangle is located in the top-left portion of the image, highlighting a specific area.
* A larger red rectangle is located in the center of the image, highlighting a larger area.
* **Rendering (w/ view frequency) (c):**
* The image shows a scene of green foliage.
* A smaller green rectangle is located in the top-left portion of the image, highlighting a specific area.
* A larger green rectangle is located in the center of the image, highlighting a larger area.
* The text "27.63dB/0.24G" is displayed in the bottom-right corner.
### Key Observations
* The image compares rendering with and without view frequency.
* The LOD levels image is in grayscale.
* The dB value is slightly higher for the rendering with view frequency (27.63dB) compared to the rendering without view frequency (27.51dB).
* The G value is significantly lower for the rendering with view frequency (0.24G) compared to the rendering without view frequency (1.16G).
### Interpretation
The image demonstrates the impact of view frequency on rendering. The LOD levels image shows the detail levels without color information. The dB values likely represent a measure of image quality (higher is better), while the G values likely represent the computational cost or memory usage (lower is better). The rendering with view frequency achieves a slightly better image quality with a significantly lower computational cost, suggesting that incorporating view frequency is an efficient rendering technique.