## Scatter Plot: Parameters vs. FLOPs for Different Language Models
### Overview
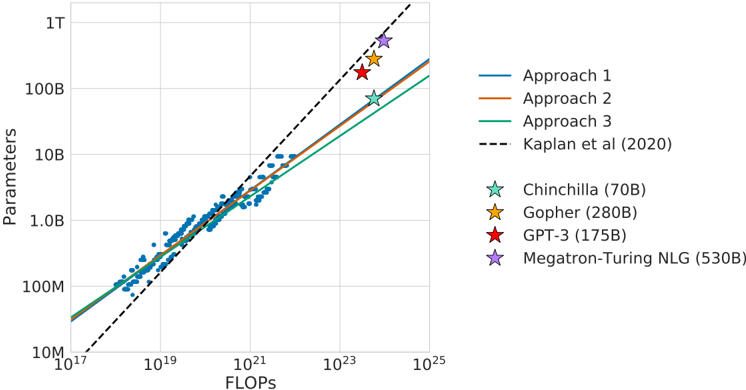
The image is a scatter plot comparing the number of parameters of different language models against the number of floating-point operations (FLOPs) used to train them. The plot includes data points for several models, along with trend lines representing different approaches and a reference line from Kaplan et al. (2020).
### Components/Axes
* **X-axis:** FLOPs (Floating Point Operations), with a logarithmic scale ranging from 10^17 to 10^25.
* **Y-axis:** Parameters, with a logarithmic scale ranging from 10M (10^7) to 1T (10^12).
* **Legend (Right side of the plot):**
* Blue Line: Approach 1
* Orange Line: Approach 2
* Green Line: Approach 3
* Black Dashed Line: Kaplan et al (2020)
* Light Blue Star: Chinchilla (70B)
* Yellow Star: Gopher (280B)
* Red Star: GPT-3 (175B)
* Purple Star: Megatron-Turing NLG (530B)
### Detailed Analysis
* **Approach 1 (Blue Line):** The blue line representing "Approach 1" shows a generally upward trend.
* At 10^17 FLOPs, the parameters are approximately 20M.
* At 10^21 FLOPs, the parameters are approximately 1B.
* At 10^24 FLOPs, the parameters are approximately 100B.
* **Approach 2 (Orange Line):** The orange line representing "Approach 2" also shows an upward trend, similar to Approach 1.
* At 10^17 FLOPs, the parameters are approximately 20M.
* At 10^21 FLOPs, the parameters are approximately 1B.
* At 10^24 FLOPs, the parameters are approximately 100B.
* **Approach 3 (Green Line):** The green line representing "Approach 3" shows an upward trend, similar to Approach 1 and Approach 2.
* At 10^17 FLOPs, the parameters are approximately 20M.
* At 10^21 FLOPs, the parameters are approximately 1B.
* At 10^24 FLOPs, the parameters are approximately 100B.
* **Kaplan et al (2020) (Black Dashed Line):** The black dashed line shows a steeper upward trend compared to the other approaches.
* At 10^17 FLOPs, the parameters are approximately 10M.
* At 10^21 FLOPs, the parameters are approximately 2B.
* At 10^24 FLOPs, the parameters are approximately 200B.
* **Chinchilla (Light Blue Star):** Located at approximately 10^23 FLOPs and 70B parameters.
* **Gopher (Yellow Star):** Located at approximately 2 * 10^23 FLOPs and 280B parameters.
* **GPT-3 (Red Star):** Located at approximately 2 * 10^23 FLOPs and 175B parameters.
* **Megatron-Turing NLG (Purple Star):** Located at approximately 3 * 10^23 FLOPs and 530B parameters.
* **Scatter Points (Blue Dots):** A cluster of blue dots is present, indicating a concentration of data points. These points generally follow the trend of Approach 1, Approach 2, and Approach 3.
### Key Observations
* The three "Approach" lines are very close to each other, suggesting similar scaling relationships between FLOPs and parameters.
* The Kaplan et al. (2020) line shows a steeper increase in parameters with respect to FLOPs compared to the other approaches.
* The named models (Chinchilla, Gopher, GPT-3, Megatron-Turing NLG) are located towards the upper-right corner of the plot, indicating higher FLOPs and parameter counts.
* The cluster of blue dots suggests a common trend among a larger set of models, with the named models representing outliers or models designed with different scaling strategies.
### Interpretation
The plot illustrates the relationship between the computational cost (FLOPs) and the size (parameters) of language models. The different approaches likely represent different training methodologies or architectural choices. The Kaplan et al. (2020) line serves as a benchmark or theoretical scaling law. The positions of the named models relative to the trend lines indicate their efficiency or deviation from the general trends. For example, models above the trend lines are more parameter-efficient for a given FLOP count. The plot suggests that increasing both FLOPs and parameters generally leads to larger models, but the specific scaling relationship can vary depending on the approach used.