## Line Graphs: log(Perplexity) vs Compacted Size by Aggregation Method
### Overview
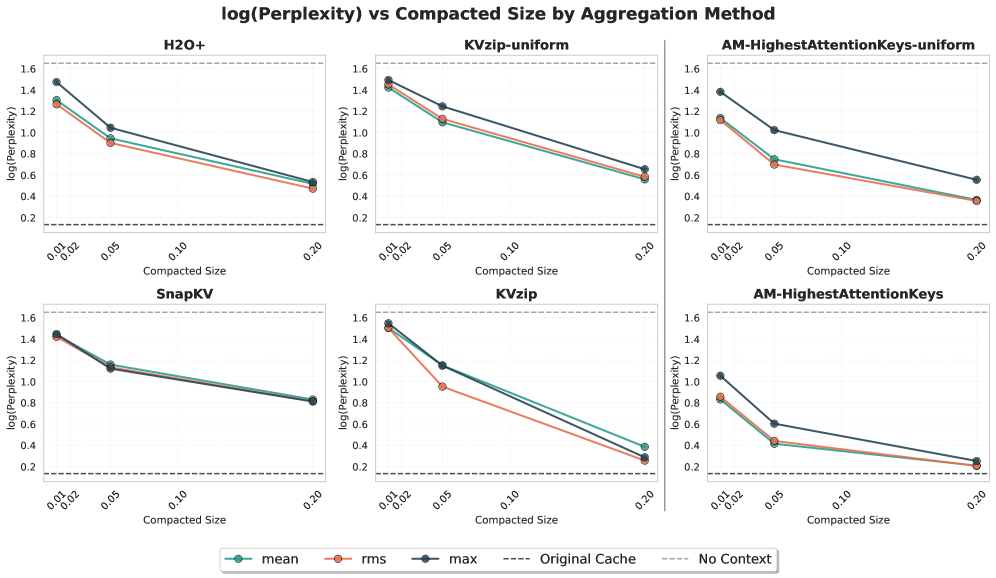
The image contains six line graphs comparing the logarithmic perplexity (log(Perplexity)) of different aggregation methods (H2O+, KVzip-uniform, AM-HighestAttentionKeys-uniform, SnapKV, KVzip, AM-HighestAttentionKeys) against compacted size. Each graph includes three data series: **mean** (teal), **rms** (orange), and **max** (dark blue), alongside two reference lines: **Original Cache** (dashed) and **No Context** (dotted). The x-axis represents compacted size (0.01 to 0.20), and the y-axis represents log(Perplexity) (0.2 to 1.6).
### Components/Axes
- **X-axis (Compacted Size)**: Logarithmic scale from 0.01 to 0.20.
- **Y-axis (log(Perplexity))**: Logarithmic scale from 0.2 to 1.6.
- **Legends**:
- **Mean** (teal circle)
- **RMS** (orange circle)
- **Max** (dark blue circle)
- **Original Cache** (dashed line)
- **No Context** (dotted line)
- **Graph Titles**: Each subplot is labeled with the aggregation method (e.g., "H2O+", "KVzip-uniform").
### Detailed Analysis
#### H2O+
- **Mean**: Starts at ~1.3 (0.01) and decreases to ~0.4 (0.20).
- **RMS**: Slightly lower than mean, starting at ~1.25 (0.01) and ending at ~0.35 (0.20).
- **Max**: Peaks at ~1.45 (0.01) and drops to ~0.5 (0.20).
- **Original Cache**: Consistently above all data series (~1.5–1.6).
- **No Context**: Lowest line (~0.2–0.3).
#### KVzip-uniform
- **Mean**: Starts at ~1.4 (0.01) and decreases to ~0.5 (0.20).
- **RMS**: Slightly lower than mean, starting at ~1.35 (0.01) and ending at ~0.4 (0.20).
- **Max**: Peaks at ~1.5 (0.01) and drops to ~0.6 (0.20).
- **Original Cache**: ~1.5–1.6.
- **No Context**: ~0.2–0.3.
#### AM-HighestAttentionKeys-uniform
- **Mean**: Starts at ~1.3 (0.01) and decreases to ~0.4 (0.20).
- **RMS**: Slightly lower than mean, starting at ~1.25 (0.01) and ending at ~0.35 (0.20).
- **Max**: Peaks at ~1.4 (0.01) and drops to ~0.5 (0.20).
- **Original Cache**: ~1.5–1.6.
- **No Context**: ~0.2–0.3.
#### SnapKV
- **Mean**: Starts at ~1.4 (0.01) and decreases to ~0.8 (0.20).
- **RMS**: Slightly lower than mean, starting at ~1.35 (0.01) and ending at ~0.7 (0.20).
- **Max**: Peaks at ~1.5 (0.01) and drops to ~0.9 (0.20).
- **Original Cache**: ~1.5–1.6.
- **No Context**: ~0.2–0.3.
#### KVzip
- **Mean**: Starts at ~1.4 (0.01) and decreases to ~0.3 (0.20).
- **RMS**: Slightly lower than mean, starting at ~1.35 (0.01) and ending at ~0.25 (0.20).
- **Max**: Peaks at ~1.5 (0.01) and drops to ~0.4 (0.20).
- **Original Cache**: ~1.5–1.6.
- **No Context**: ~0.2–0.3.
#### AM-HighestAttentionKeys
- **Mean**: Starts at ~1.3 (0.01) and decreases to ~0.2 (0.20).
- **RMS**: Slightly lower than mean, starting at ~1.25 (0.01) and ending at ~0.15 (0.20).
- **Max**: Peaks at ~1.4 (0.01) and drops to ~0.3 (0.20).
- **Original Cache**: ~1.5–1.6.
- **No Context**: ~0.2–0.3.
### Key Observations
1. **Trend**: All data series show a **decreasing trend** in log(Perplexity) as compacted size increases, indicating improved performance with larger compacted sizes.
2. **Original Cache**: Consistently the highest line across all methods, suggesting it is the least effective at reducing perplexity.
3. **No Context**: The lowest line in all graphs, indicating it performs the worst.
4. **Method-Specific Performance**:
- **AM-HighestAttentionKeys** and **KVzip** show the steepest declines, suggesting they are more efficient at reducing perplexity.
- **SnapKV** and **H2O+** have moderate declines, while **KVzip-uniform** and **AM-HighestAttentionKeys-uniform** show similar trends to their non-uniform counterparts.
5. **Outliers**: The **Original Cache** line is consistently above all data series, highlighting its inefficiency compared to other methods.
### Interpretation
The data demonstrates that **aggregation methods** significantly impact perplexity reduction as models are compacted. Lower log(Perplexity) values (closer to the "No Context" line) indicate better performance. The **Original Cache** line’s consistent high values suggest it is a suboptimal baseline, while methods like **AM-HighestAttentionKeys** and **KVzip** outperform others, likely due to their attention-based or compression-focused strategies. The **No Context** line underscores the importance of contextual information in maintaining low perplexity. These trends align with the hypothesis that advanced aggregation techniques (e.g., attention mechanisms) are more effective at preserving model performance during compression.