\n
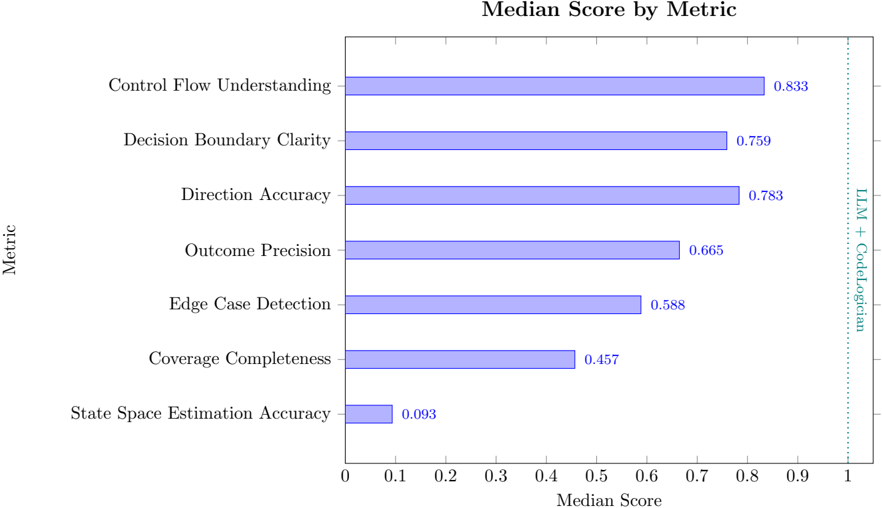
## Bar Chart: Median Score by Metric
### Overview
This is a horizontal bar chart displaying the median score for seven different metrics. The chart is titled "Median Score by Metric" and appears to represent the performance of a system or model (likely LLM + CodeLlama, as indicated by the text on the right side of the chart). The metrics are listed on the vertical axis, and the median scores are represented by the length of the horizontal bars on the horizontal axis.
### Components/Axes
* **Title:** "Median Score by Metric" (centered at the top)
* **Vertical Axis (Y-axis):** Labeled "Metric". The metrics listed from top to bottom are:
* Control Flow Understanding
* Decision Boundary Clarity
* Direction Accuracy
* Outcome Precision
* Edge Case Detection
* Coverage Completeness
* State Space Estimation Accuracy
* **Horizontal Axis (X-axis):** Labeled "Median Score". The scale ranges from 0 to 1, with increments of 0.1.
* **Annotation:** "LLM + CodeLlama" is written vertically on the right side of the chart.
### Detailed Analysis
The chart consists of seven horizontal bars, each representing the median score for a specific metric. The bars are all the same light purple color.
* **Control Flow Understanding:** The bar extends to approximately 0.833.
* **Decision Boundary Clarity:** The bar extends to approximately 0.759.
* **Direction Accuracy:** The bar extends to approximately 0.783.
* **Outcome Precision:** The bar extends to approximately 0.665.
* **Edge Case Detection:** The bar extends to approximately 0.588.
* **Coverage Completeness:** The bar extends to approximately 0.457.
* **State Space Estimation Accuracy:** The bar extends to approximately 0.093.
The bars are arranged in descending order of median score, with "Control Flow Understanding" having the highest score and "State Space Estimation Accuracy" having the lowest.
### Key Observations
* "Control Flow Understanding" has a significantly higher median score than all other metrics.
* "State Space Estimation Accuracy" has a very low median score, significantly lower than all other metrics.
* The scores generally decrease as you move down the list of metrics.
* The scores are relatively clustered between 0.457 and 0.833, except for the outlier "State Space Estimation Accuracy".
### Interpretation
The data suggests that the LLM + CodeLlama system performs well in understanding control flow and decision boundaries, but struggles with state space estimation. The large difference in scores indicates a potential weakness in the system's ability to accurately estimate the state space. The relatively high scores for "Direction Accuracy" and "Outcome Precision" suggest the system is generally good at providing correct and relevant outputs. The moderate score for "Edge Case Detection" indicates some ability to handle unusual or unexpected inputs, but there is room for improvement.
The arrangement of the bars in descending order allows for a quick visual comparison of the system's performance across different metrics. The annotation "LLM + CodeLlama" indicates that these scores are specifically for this combined system, and may not generalize to other models or approaches. The data could be used to identify areas where the system needs further development or refinement. The low score for "State Space Estimation Accuracy" is a particularly important finding, as it could have implications for the system's reliability and robustness.