## Chart: MSE vs. Pilot Size for Different Algorithms
### Overview
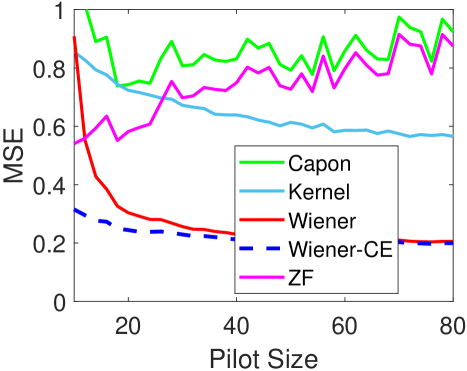
The image is a line chart comparing the Mean Squared Error (MSE) performance of five different algorithms (Capon, Kernel, Wiener, Wiener-CE, and ZF) as a function of Pilot Size. The x-axis represents the Pilot Size, ranging from approximately 0 to 80. The y-axis represents the MSE, ranging from 0 to 1.
### Components/Axes
* **X-axis:** Pilot Size, ranging from 0 to 80. Axis markers are present at 20, 40, 60, and 80.
* **Y-axis:** MSE (Mean Squared Error), ranging from 0 to 1. Axis markers are present at 0, 0.2, 0.4, 0.6, 0.8, and 1.
* **Legend:** Located on the right side of the chart, identifying each algorithm by color:
* **Green:** Capon
* **Light Blue:** Kernel
* **Red:** Wiener
* **Dashed Dark Blue:** Wiener-CE
* **Magenta:** ZF
### Detailed Analysis
* **Capon (Green):** The MSE starts around 0.8 and fluctuates between 0.7 and 0.9 as the pilot size increases. The trend is relatively flat, with no significant decrease or increase.
* **Kernel (Light Blue):** The MSE starts around 0.8 and gradually decreases to approximately 0.6 as the pilot size increases. The trend is a slow, steady decline.
* **Wiener (Red):** The MSE starts high, around 0.9, and rapidly decreases to approximately 0.2 by a pilot size of 40. After that, it remains relatively constant around 0.2.
* **Wiener-CE (Dashed Dark Blue):** The MSE starts around 0.3 and decreases slightly to approximately 0.2 as the pilot size increases. The trend is a slight downward slope, stabilizing around 0.2.
* **ZF (Magenta):** The MSE starts around 0.6 and fluctuates between 0.6 and 0.8 as the pilot size increases. The trend is relatively flat, with some variation.
### Key Observations
* The Wiener algorithm (red line) exhibits the most significant initial decrease in MSE as the pilot size increases.
* The Wiener-CE algorithm (dashed dark blue line) consistently has the lowest MSE across all pilot sizes.
* The Capon (green line) and ZF (magenta line) algorithms show relatively flat MSE performance with increasing pilot size.
* The Kernel algorithm (light blue line) shows a gradual decrease in MSE as the pilot size increases.
### Interpretation
The chart illustrates the performance of different algorithms in terms of MSE as the pilot size varies. The Wiener algorithm benefits most from an initial increase in pilot size, quickly reducing its MSE. The Wiener-CE algorithm consistently outperforms the others, maintaining the lowest MSE across all pilot sizes, suggesting it is the most robust to changes in pilot size. The Capon and ZF algorithms appear less sensitive to pilot size, showing relatively stable but higher MSE values. The Kernel algorithm shows a moderate improvement with increasing pilot size.
The data suggests that for this specific scenario, the Wiener-CE algorithm is the most effective in minimizing MSE, regardless of the pilot size. The choice of algorithm would depend on the trade-off between complexity, computational cost, and desired MSE performance.