## Diagram: Align Module
### Overview
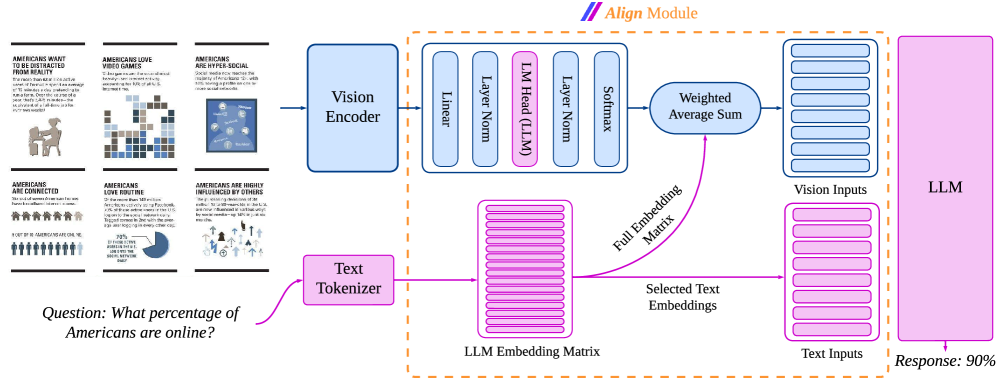
The image is a diagram illustrating the "Align Module" of a system, likely a neural network or AI model. It shows the flow of information from visual and textual inputs through various processing stages, ultimately leading to a response. The diagram includes components like Vision Encoder, Text Tokenizer, LLM (Language Model) Embedding Matrix, and other layers, culminating in a final response. The diagram also includes example data that the model is trained on.
### Components/Axes
* **Title:** Align Module (located at the top-center of the image)
* **Input Data (Left Side):**
* A series of six infographic-style panels showing statistics about Americans.
* Panel 1: "AMERICANS WANT TO BE DISTRACTED FROM REALITY"
* Panel 2: "AMERICANS LOVE VIDEO GAMES"
* Panel 3: "AMERICANS ARE HYPER-SOCIAL"
* Panel 4: "AMERICANS ARE CONNECTED"
* Panel 5: "AMERICANS LOVE ROUTINE"
* Panel 6: "AMERICANS ARE HIGHLY INFLUENCED BY OTHERS"
* A question: "Question: What percentage of Americans are online?"
* **Processing Blocks (Center):**
* Vision Encoder (blue box)
* Text Tokenizer (pink box)
* Linear (blue box)
* Layer Norm (blue box)
* LM Head (LLM) (pink box)
* Softmax (blue box)
* Weighted Average Sum (blue rounded box)
* LLM Embedding Matrix (pink stacked rectangles)
* Full Embedding Matrix (label for the pink arrow)
* Selected Text Embeddings (label for the pink stacked rectangles)
* Vision Inputs (blue stacked rectangles)
* Text Inputs (pink stacked rectangles)
* **Output (Right Side):**
* LLM (pink box)
* Response: 90% (located at the bottom-right)
### Detailed Analysis or ### Content Details
* **Input Data:**
* The infographic panels present various statistics about American behavior and preferences. The exact numerical data within each panel is not fully legible but the titles are clear.
* The question "What percentage of Americans are online?" serves as a prompt for the system.
* **Processing Flow:**
* The Vision Encoder processes visual information (presumably from the infographic panels).
* The Text Tokenizer processes the textual question.
* The LLM Embedding Matrix stores embeddings of the text.
* The Linear, Layer Norm, LM Head (LLM), and Softmax layers perform transformations on the encoded data.
* The Weighted Average Sum combines the processed visual and textual information.
* The "Full Embedding Matrix" arrow indicates the flow of information from the LLM Embedding Matrix to the Weighted Average Sum.
* The Vision Inputs and Text Inputs represent the processed visual and textual data, respectively.
* **Output:**
* The LLM produces a response, which in this case is "90%".
### Key Observations
* The diagram illustrates a multi-modal system that integrates visual and textual information.
* The use of "Vision Encoder" and "Text Tokenizer" suggests that the system can process both images and text.
* The "LLM Embedding Matrix" indicates the use of a Language Model for processing text.
* The "Weighted Average Sum" suggests that the system combines visual and textual information based on their relative importance.
* The final "Response: 90%" indicates that the system is answering the question based on the provided information.
### Interpretation
The diagram depicts the architecture and flow of information within an "Align Module," which appears to be a component of a larger AI system. The module takes visual and textual inputs, processes them through various layers and transformations, and generates a response. The example provided shows the system answering a question about the percentage of Americans online, based on the information presented in the infographic panels. This suggests that the system can understand and integrate information from multiple sources to provide accurate and relevant answers. The diagram highlights the importance of multi-modal processing and the use of Language Models in modern AI systems.