## Line Chart: Accuracy vs. Thinking Compute
### Overview
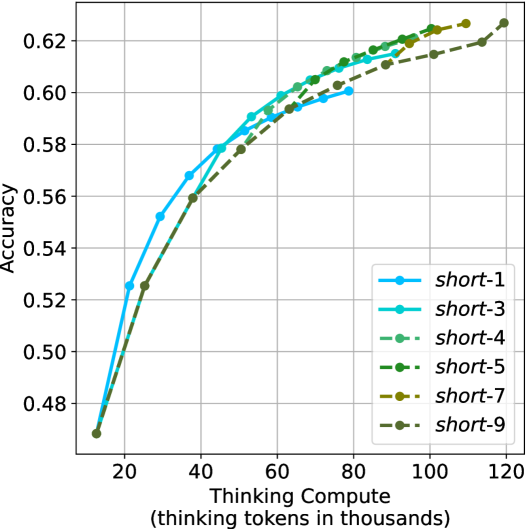
The image is a line chart comparing the accuracy of different models ("short-1" to "short-9") against the "Thinking Compute" (measured in thousands of thinking tokens). The chart shows how accuracy increases with more compute for each model.
### Components/Axes
* **X-axis:** "Thinking Compute (thinking tokens in thousands)". Scale ranges from 20 to 120 in increments of 20.
* **Y-axis:** "Accuracy". Scale ranges from 0.48 to 0.62 in increments of 0.02.
* **Legend:** Located in the bottom-right of the chart. It identifies each line by its corresponding model name:
* `short-1`: Blue solid line with circle markers.
* `short-3`: Cyan solid line with circle markers.
* `short-4`: Green dashed line with circle markers.
* `short-5`: Dark Green dashed line with circle markers.
* `short-7`: Olive dashed line with circle markers.
* `short-9`: Dark Olive dashed line with circle markers.
### Detailed Analysis
* **short-1 (Blue):** Starts at approximately (16, 0.47) and increases rapidly to (40, 0.57), then continues to (60, 0.59), (80, 0.61), and ends at approximately (90, 0.615).
* **short-3 (Cyan):** Starts at approximately (16, 0.47) and increases rapidly to (40, 0.58), then continues to (60, 0.595), (80, 0.615), and ends at approximately (90, 0.62).
* **short-4 (Green):** Starts at approximately (16, 0.47) and increases rapidly to (40, 0.59), then continues to (60, 0.60), (80, 0.61), and ends at approximately (100, 0.62).
* **short-5 (Dark Green):** Starts at approximately (16, 0.47) and increases rapidly to (40, 0.56), then continues to (60, 0.59), (80, 0.60), (100, 0.62), and ends at approximately (120, 0.63).
* **short-7 (Olive):** Starts at approximately (16, 0.47) and increases rapidly to (40, 0.56), then continues to (60, 0.59), (80, 0.60), (100, 0.62), and ends at approximately (120, 0.63).
* **short-9 (Dark Olive):** Starts at approximately (16, 0.47) and increases rapidly to (40, 0.56), then continues to (60, 0.59), (80, 0.60), (100, 0.62), and ends at approximately (120, 0.63).
### Key Observations
* All models show a positive correlation between "Thinking Compute" and "Accuracy".
* The accuracy increases rapidly at lower compute values and then plateaus as compute increases.
* The models "short-5", "short-7", and "short-9" appear to perform similarly, achieving slightly higher accuracy at higher compute values compared to "short-1" and "short-3".
### Interpretation
The chart demonstrates the relationship between the amount of computational resources ("Thinking Compute") allocated to different models and their resulting accuracy. The initial rapid increase in accuracy suggests that even a small amount of compute can significantly improve performance. However, the plateauing effect indicates diminishing returns, where increasing compute beyond a certain point yields only marginal gains in accuracy. The models "short-5", "short-7", and "short-9" seem to be more efficient in utilizing higher compute values to achieve slightly better accuracy compared to the other models. This could be due to differences in their architecture or training methodologies.