## Line Chart: Accuracy vs. Thinking Compute
### Overview
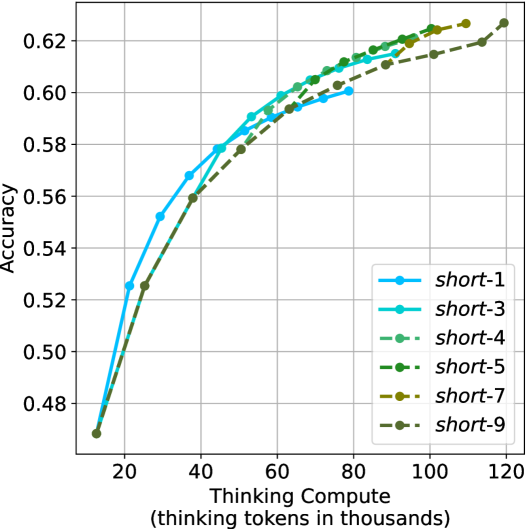
This chart illustrates the relationship between "Thinking Compute" (measured in thousands of thinking tokens) and model "Accuracy" for six distinct model variants labeled `short-1` through `short-9`. The chart demonstrates a positive correlation between compute resources and accuracy, characterized by diminishing returns as compute increases.
### Components/Axes
* **Y-Axis:** Labeled "Accuracy". The scale ranges from 0.48 to 0.62, with the data series originating at approximately 0.47.
* **X-Axis:** Labeled "Thinking Compute (thinking tokens in thousands)". The scale ranges from 20 to 120, with the data series originating at approximately 15.
* **Legend:** Located in the bottom-right quadrant of the chart. It defines six data series:
* `short-1`: Light blue, solid line.
* `short-3`: Cyan, solid line.
* `short-4`: Light green, dashed line.
* `short-5`: Medium green, dashed line.
* `short-7`: Olive green, dashed line.
* `short-9`: Dark olive/brown, dashed line.
### Detailed Analysis
The chart displays a clear, consistent trend across all six models.
**Trend Verification:**
* **Common Origin:** All six data series originate from a single point at approximately (15k tokens, 0.47 accuracy).
* **Positive Correlation:** Every line slopes upward, indicating that increasing the thinking compute consistently improves accuracy.
* **Diminishing Returns:** The slope of every line is steepest at the beginning (15k–40k tokens) and flattens out as compute increases, indicating that additional compute yields smaller accuracy gains at higher levels.
* **Divergence:** While the models start together, they terminate at different points along the X-axis, suggesting different maximum compute capacities.
**Data Series Characteristics:**
* **Solid Lines (`short-1`, `short-3`):** These models have the lowest maximum compute capacity.
* `short-1` (light blue) terminates at approximately 80k tokens with an accuracy of ~0.60.
* `short-3` (cyan) terminates at approximately 95k tokens with an accuracy of ~0.615.
* **Dashed Lines (`short-4`, `short-5`, `short-7`, `short-9`):** These models allow for higher compute budgets.
* `short-4` (light green) terminates at approximately 100k tokens with an accuracy of ~0.62.
* `short-5` (medium green) terminates at approximately 105k tokens with an accuracy of ~0.622.
* `short-7` (olive) terminates at approximately 110k tokens with an accuracy of ~0.625.
* `short-9` (dark olive) terminates at approximately 120k tokens with an accuracy of ~0.628.
### Key Observations
* **Compute Capacity Scaling:** The "short-*" naming convention appears to correlate directly with the maximum allowed thinking compute. Higher numbers allow for more tokens.
* **Performance Parity:** At any specific compute level (e.g., 60k tokens), all models that are capable of reaching that level show nearly identical accuracy. This suggests that the accuracy is primarily a function of the compute budget, rather than architectural differences between the `short-1` through `short-9` variants.
* **Accuracy Ceiling:** The accuracy appears to be approaching a hard ceiling or asymptote around 0.63. Even with the highest compute (`short-9` at 120k tokens), the gains are marginal compared to the gains seen between 20k and 60k tokens.
### Interpretation
This chart provides empirical evidence of "scaling laws" applied to inference-time compute. It demonstrates that for this specific task, "thinking" (generating tokens before providing an answer) is a reliable lever for increasing accuracy.
The data suggests that `short-1` through `short-9` are likely the same underlying model, simply constrained by different maximum token budgets. The fact that the lines overlap so closely indicates that there is no "penalty" for using a model with a higher capacity; rather, the higher-numbered models are simply more flexible, allowing the user to trade more compute for slightly higher accuracy. The diminishing returns suggest that there is an optimal "sweet spot" for compute—likely around 60k–80k tokens—where the accuracy gain per token is highest before the curve flattens.