## Line Graph: Loss Value vs. Epoch for Individual and Lifelong Training
### Overview
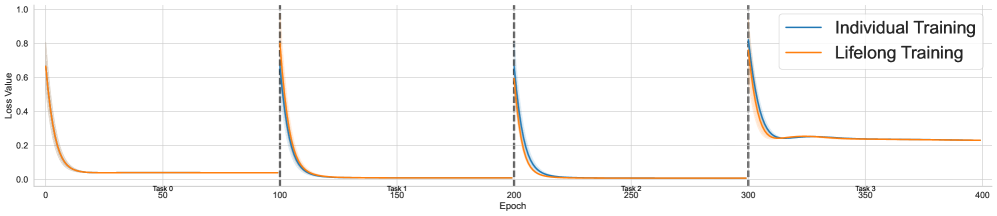
The image is a line graph comparing the loss value over epochs for two training methods: Individual Training (blue line) and Lifelong Training (orange line). The graph shows the performance across four tasks, separated by vertical dashed lines. The x-axis represents the epoch, and the y-axis represents the loss value.
### Components/Axes
* **Title:** Implicit, but the graph compares "Individual Training" and "Lifelong Training" in terms of "Loss Value" over "Epoch".
* **X-axis:** Epoch, ranging from 0 to 400. Tick marks are present at intervals of 50 epochs. The tasks are labeled along the x-axis as Task 0, Task 1, Task 2, and Task 3.
* **Y-axis:** Loss Value, ranging from 0.0 to 1.0. Tick marks are present at intervals of 0.2.
* **Legend:** Located in the top-right corner.
* Blue line: Individual Training
* Orange line: Lifelong Training
* **Vertical Dashed Lines:** These lines separate the different tasks. They are located at approximately epoch 100, 200, and 300.
### Detailed Analysis
**Task 0 (Epoch 0-100):**
* **Individual Training (Blue):** Starts at a loss value of approximately 0.8 and rapidly decreases to approximately 0.0 by epoch 50. It remains near 0.0 for the rest of the task.
* **Lifelong Training (Orange):** Starts at a loss value of approximately 0.8 and rapidly decreases to approximately 0.0 by epoch 50. It remains near 0.0 for the rest of the task.
**Task 1 (Epoch 100-200):**
* **Individual Training (Blue):** The loss value jumps to approximately 0.8 at epoch 100 and rapidly decreases to approximately 0.0 by epoch 150. It remains near 0.0 for the rest of the task.
* **Lifelong Training (Orange):** The loss value jumps to approximately 0.8 at epoch 100 and rapidly decreases to approximately 0.0 by epoch 150. It remains near 0.0 for the rest of the task.
**Task 2 (Epoch 200-300):**
* **Individual Training (Blue):** The loss value jumps to approximately 0.7 at epoch 200 and rapidly decreases to approximately 0.0 by epoch 250. It remains near 0.0 for the rest of the task.
* **Lifelong Training (Orange):** The loss value jumps to approximately 0.7 at epoch 200 and rapidly decreases to approximately 0.0 by epoch 250. It remains near 0.0 for the rest of the task.
**Task 3 (Epoch 300-400):**
* **Individual Training (Blue):** The loss value jumps to approximately 0.25 at epoch 300 and remains relatively stable around 0.25 for the rest of the task.
* **Lifelong Training (Orange):** The loss value jumps to approximately 0.25 at epoch 300 and remains relatively stable around 0.25 for the rest of the task.
### Key Observations
* For the first three tasks (Task 0, Task 1, and Task 2), both Individual Training and Lifelong Training exhibit similar performance, with a rapid decrease in loss value after each task begins.
* In Task 3, both training methods show a higher final loss value compared to the previous tasks.
* The performance of Individual Training and Lifelong Training is nearly identical across all tasks.
### Interpretation
The graph suggests that for the first three tasks, both Individual Training and Lifelong Training are equally effective in reducing the loss value. The rapid decrease in loss indicates that the models quickly learn the tasks. However, Task 3 presents a challenge, as both training methods result in a higher final loss value, suggesting that this task is more difficult or requires a different approach. The near-identical performance of the two training methods implies that, in this scenario, lifelong learning does not provide a significant advantage over individual training for these specific tasks. The consistent pattern of loss increase at the start of each task followed by a rapid decrease indicates a need for re-learning or adaptation at the beginning of each new task.