## Line Chart: Accuracy vs. Thinking Compute
### Overview
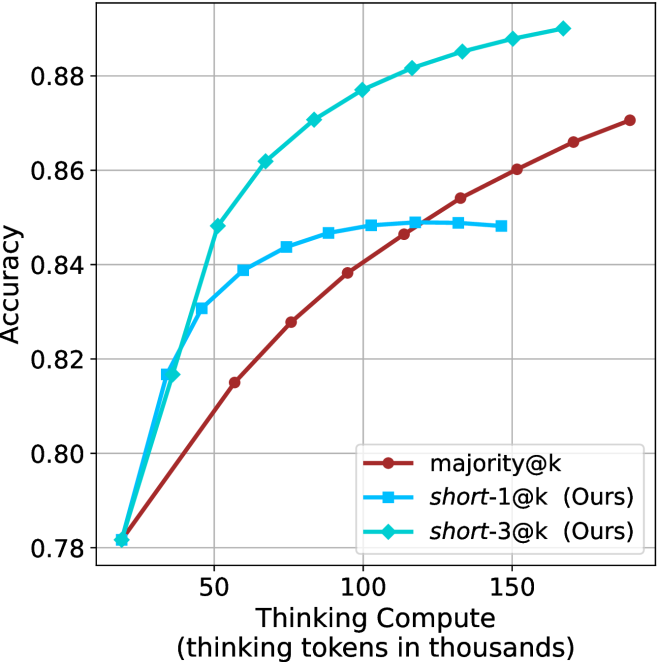
This image is a line chart comparing the performance of three different methods—`majority@k`, `short-1@k (Ours)`, and `short-3@k (Ours)`—based on their accuracy relative to the amount of "Thinking Compute" utilized (measured in thousands of thinking tokens). The chart demonstrates that while all methods start at the same baseline, they diverge significantly as compute increases, with the "short-3@k" method achieving the highest accuracy.
### Components/Axes
* **Y-Axis (Vertical):** Labeled "Accuracy". The scale ranges from 0.78 to 0.88, with major grid lines at intervals of 0.02.
* **X-Axis (Horizontal):** Labeled "Thinking Compute (thinking tokens in thousands)". The scale shows major ticks at 50, 100, and 150. The data series begins at approximately 20 (thousands of tokens).
* **Legend:** Located in the bottom-right quadrant of the chart area.
* **majority@k:** Represented by a dark red line with circular markers.
* **short-1@k (Ours):** Represented by a medium blue line with square markers.
* **short-3@k (Ours):** Represented by a cyan (light blue) line with diamond markers.
### Detailed Analysis
#### Trend Verification
* **majority@k (Dark Red, Circles):** This series exhibits a steady, nearly linear upward trend across the entire X-axis range. It does not show signs of plateauing within the visible chart area.
* **short-1@k (Ours) (Medium Blue, Squares):** This series shows a rapid initial increase in accuracy, followed by a distinct "elbow" or curve where the rate of improvement slows significantly, eventually plateauing around 110-150k tokens.
* **short-3@k (Ours) (Cyan, Diamonds):** This series shows the steepest initial growth. It maintains a strong upward trajectory throughout the chart, consistently outperforming the other two methods.
#### Data Points (Approximate Values)
*Note: Values are estimated based on visual position relative to grid lines.*
| Thinking Compute (k) | majority@k (Red) | short-1@k (Blue) | short-3@k (Cyan) |
| :--- | :--- | :--- | :--- |
| ~20 | ~0.781 | ~0.781 | ~0.781 |
| ~35 | ~0.795 | ~0.817 | ~0.817 |
| ~50 | ~0.815 | ~0.831 | ~0.848 |
| ~65 | ~0.822 | ~0.839 | ~0.862 |
| ~80 | ~0.828 | ~0.844 | ~0.871 |
| ~100 | ~0.838 | ~0.847 | ~0.877 |
| ~115 | ~0.847 | ~0.848 | ~0.882 |
| ~135 | ~0.854 | ~0.849 | ~0.885 |
| ~150 | ~0.860 | ~0.848 | ~0.888 |
| ~165 | ~0.866 | N/A | ~0.890 |
| ~190 | ~0.871 | N/A | N/A |
### Key Observations
* **Convergence at Start:** All three methods begin at the same point (~0.781 accuracy at ~20k tokens).
* **Performance Ceiling:** The `short-1@k` method hits a performance ceiling (diminishing returns) around 100k tokens, where accuracy stabilizes near 0.848.
* **Superiority of short-3@k:** The `short-3@k` method is the most effective. It diverges sharply from the other two methods after the 35k token mark and continues to climb, reaching the highest accuracy of ~0.890.
* **Baseline Performance:** The `majority@k` method, while the slowest to improve, maintains a consistent growth rate, suggesting it might eventually catch up to the `short-1@k` method if compute were increased significantly beyond 200k tokens.
### Interpretation
The data suggests that the "short" methods (specifically `short-3@k`) are significantly more efficient at converting "thinking compute" into accuracy compared to the `majority@k` baseline.
The "short-3@k" method demonstrates a superior scaling law, where additional thinking tokens yield higher marginal gains in accuracy compared to the other methods. The "short-1@k" method appears to be a "quick start" optimization that provides early gains but lacks the capacity for higher-level reasoning or refinement that "short-3@k" provides, as evidenced by its plateau. This chart effectively demonstrates that the "short-3@k" approach is the optimal strategy for high-compute scenarios.