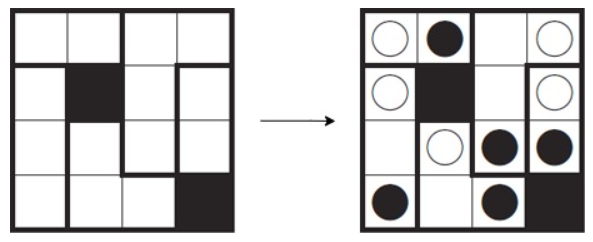
## Diagram: Before-and-After Grid Transformation
### Overview
The image displays a two-panel diagram illustrating a transformation process. On the left is an initial 4x4 grid state, and on the right is the resulting state after an unspecified operation, indicated by a right-pointing arrow between them. The grids are composed of cells, some of which are filled with solid black squares. The transformed grid introduces circular markers (white/hollow and black/filled) into previously empty cells.
### Components/Axes
* **Structure:** Two 4x4 grids. Each grid is subdivided by thicker lines into four 2x2 quadrants.
* **Left Grid (Initial State):**
* Contains two solid black squares.
* All other cells are empty (white).
* **Right Grid (Transformed State):**
* Retains the two original solid black squares in their exact positions.
* Introduces circular markers into previously empty cells:
* **White (Hollow) Circles:** 5 instances.
* **Black (Filled) Circles:** 5 instances.
* **Arrow:** A simple, black, right-pointing arrow (`→`) centered between the two grids, indicating the direction of transformation.
* **Text:** No textual labels, titles, or annotations are present in the image.
### Detailed Analysis
**Spatial Mapping and Element Placement:**
(Using (Row, Column) notation, where Row 1 is the top row and Column 1 is the leftmost column.)
**1. Left Grid (Initial State):**
* **Black Squares:** Located at positions (2, 2) and (4, 4).
* **Empty Cells:** All other 14 positions.
**2. Right Grid (Transformed State):**
* **Persistent Black Squares:** Remain at (2, 2) and (4, 4).
* **White (Hollow) Circles:** Placed at:
* (1, 1) - Top-left quadrant
* (1, 4) - Top-right quadrant
* (2, 1) - Top-left quadrant
* (2, 4) - Top-right quadrant
* (3, 2) - Bottom-left quadrant
* **Black (Filled) Circles:** Placed at:
* (1, 2) - Top-left quadrant
* (3, 3) - Bottom-right quadrant
* (3, 4) - Bottom-right quadrant
* (4, 1) - Bottom-left quadrant
* (4, 3) - Bottom-right quadrant
**Transformation Summary:** The operation populates 10 of the 14 originally empty cells with circles. The distribution is not uniform: the top two quadrants receive only white circles (except for one black circle at (1,2)), while the bottom two quadrants receive a mix, with a concentration of black circles in the bottom-right quadrant.
### Key Observations
1. **Conservation:** The two original black squares are immutable anchors in the transformation.
2. **Pattern Introduction:** The transformation introduces a new layer of information (circles) without altering the base grid structure.
3. **Asymmetric Distribution:** The placement of circles is not random. There is a clear spatial bias:
* The top half of the grid contains 4 white circles and 1 black circle.
* The bottom half contains 1 white circle and 4 black circles.
4. **Quadrant Logic:** Each 2x2 quadrant contains at least one circle. The bottom-right quadrant is the most densely populated, containing three circles (two black, one white) and one original black square.
### Interpretation
This diagram is a classic representation of a **state transition** or **rule application** in a discrete system. It visually answers the question: "Given this starting configuration (left), what does the system produce (right)?"
* **What the Data Suggests:** The transformation rule appears to be context-sensitive, likely dependent on the position of the initial black squares or the quadrant boundaries. The stark difference in circle color distribution between the top and bottom halves suggests the rule may involve a vertical axis of symmetry or a directional component (e.g., "fill from the bottom").
* **Relationship Between Elements:** The arrow is the critical operator. It signifies a process that reads the initial state and writes the final state. The persistent black squares act as fixed obstacles or seeds around which the new pattern (circles) is generated.
* **Notable Anomalies/Patterns:** The single black circle at (1,2) in the top-left quadrant is an outlier in its half of the grid. This could indicate a special condition met at that cell (e.g., adjacency to the black square at (2,2)). The clustering of black circles in the bottom-right quadrant, which also contains a black square, suggests a possible "influence" or "propagation" effect from that anchor point.
* **Potential Context:** Without explicit labels, this could represent numerous concepts: a puzzle solution (like a nonogram or minesweeper logic), a cellular automaton step, a diagram of a sorting or placement algorithm, or a visual metaphor for data encoding. The lack of text forces the viewer to infer the rule purely from the spatial relationship between the two states, making it an exercise in pattern recognition and logical deduction.