## Image Analysis: Learning Dynamics Visualization
### Overview
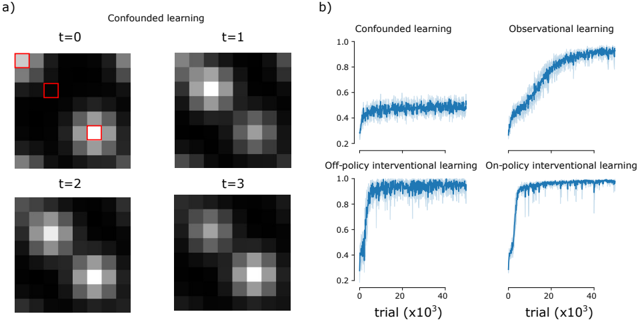
The image presents a visualization of learning dynamics under different learning paradigms. Part (a) shows a series of heatmaps representing the learned value function over time (t=0 to t=3) for "Confounded learning". A red square highlights a region of interest in the initial heatmap. Part (b) displays learning curves for four different learning methods: Confounded learning, Observational learning, Off-policy Interventional learning, and On-policy Interventional learning. The learning curves plot performance (y-axis, ranging from 0 to 1.0) against the number of trials (x-axis, in units of 10^3).
### Components/Axes
**Part (a): Confounded Learning Heatmaps**
* **Title:** "Confounded learning" (top-center)
* **Time Steps:** t=0, t=1, t=2, t=3 (labeled above each heatmap)
* **Heatmap Intensity:** Represents the value function, with lighter shades indicating higher values and darker shades indicating lower values.
* **Red Square:** Located in the top-left heatmap (t=0), indicating a specific region of interest.
**Part (b): Learning Curves**
* **Title:** Four subplots, each with a learning method title: "Confounded learning", "Observational learning", "Off-policy Interventional learning", "On-policy Interventional learning".
* **X-axis:** "trial (x10³)" ranging from approximately 0 to 45,000.
* **Y-axis:** A scale from 0.0 to 1.0, representing performance.
* **Data Series:** Each subplot contains a single blue line representing the learning curve, with a shaded area indicating the standard deviation.
### Detailed Analysis or Content Details
**Part (a): Confounded Learning Heatmaps**
* **t=0:** The heatmap shows a bright spot in the center and a red square in the top-left corner. The intensity is highest in the center.
* **t=1:** The bright spot has spread and become less focused. The intensity is still highest in the center, but the red square region has diminished in intensity.
* **t=2:** The bright spot continues to spread, becoming more diffuse. The intensity is still centered.
* **t=3:** The bright spot is now quite diffuse, with a broad area of moderate intensity. The intensity is still centered.
**Part (b): Learning Curves**
* **Confounded Learning:** The learning curve starts at approximately 0.2 and gradually increases to around 0.6, with significant fluctuations. It plateaus around 0.6.
* **Observational Learning:** The learning curve starts at approximately 0.2 and rapidly increases to around 0.95, with minimal fluctuations. It plateaus around 0.95.
* **Off-policy Interventional Learning:** The learning curve starts at approximately 0.2 and rapidly increases to around 0.85, with some fluctuations. It plateaus around 0.85.
* **On-policy Interventional Learning:** The learning curve starts at approximately 0.2 and rapidly increases to around 0.9, with minimal fluctuations. It plateaus around 0.9.
### Key Observations
* The "Confounded learning" heatmap shows how the learned value function spreads over time, potentially indicating a lack of precise localization.
* The "Confounded learning" learning curve exhibits slow and unstable learning, reaching a relatively low performance level.
* "Observational learning" and "On-policy Interventional learning" demonstrate fast and stable learning, achieving high performance levels.
* "Off-policy Interventional learning" shows fast learning, but plateaus at a slightly lower performance level than "Observational learning" and "On-policy Interventional learning".
### Interpretation
The image demonstrates the impact of different learning paradigms on learning dynamics and performance. The "Confounded learning" approach appears to suffer from a lack of precision in the learned value function (as seen in the spreading heatmap) and slow, unstable learning (as seen in the learning curve). This suggests that confounding factors hinder the agent's ability to accurately estimate the value of different states.
In contrast, "Observational learning" and the interventional learning methods exhibit faster and more stable learning, indicating that they are more effective at overcoming the challenges posed by confounding factors. The slight difference in performance between "Off-policy" and "On-policy" interventional learning might be due to the inherent biases associated with off-policy learning.
The red square in the initial heatmap (t=0) likely represents the initial focus of the learning agent. The subsequent spreading of the bright spot suggests that the agent is struggling to maintain its focus and is instead generalizing its value estimates across a broader range of states. This generalization could be a consequence of the confounding factors, which prevent the agent from accurately distinguishing between different states.