## Line Graph: Aggregate System Memory Bandwidth vs. Offload Ratio
### Overview
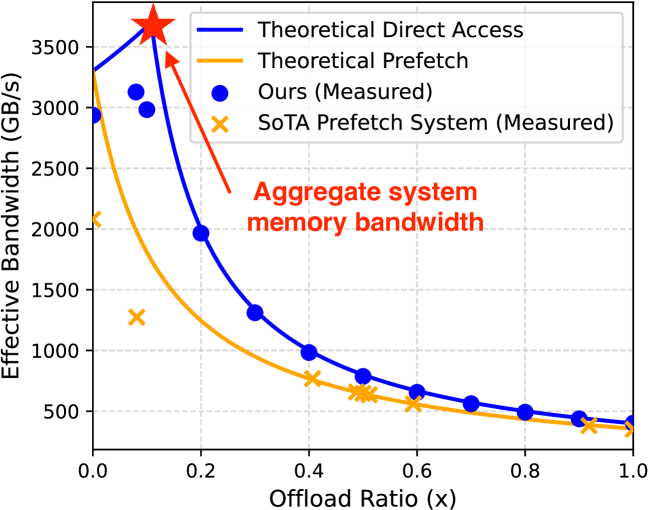
The graph illustrates the relationship between effective memory bandwidth (GB/s) and offload ratio (x) for two memory access strategies: **Theoretical Direct Access** and **Theoretical Prefetch**, alongside measured results for "Ours" and "SoTA Prefetch System." Key trends include a sharp decline in bandwidth for both strategies as offload ratio increases, with a notable peak at x=0.1.
---
### Components/Axes
- **X-axis**: Offload Ratio (x) ranging from 0.0 to 1.0 in increments of 0.2.
- **Y-axis**: Effective Bandwidth (GB/s) ranging from 0 to 3500 in increments of 500.
- **Legend**: Located in the top-right corner, with four entries:
- **Blue line**: Theoretical Direct Access
- **Orange line**: Theoretical Prefetch
- **Blue dots**: Ours (Measured)
- **Orange crosses**: SoTA Prefetch System (Measured)
- **Annotations**:
- Red star and arrow highlight the peak at x=0.1 for Theoretical Direct Access.
- Red text: "Aggregate system memory bandwidth."
---
### Detailed Analysis
1. **Theoretical Direct Access (Blue Line)**:
- Starts at ~3500 GB/s at x=0.0.
- Drops sharply to ~400 GB/s at x=1.0.
- Peak at x=0.1 (~3500 GB/s), marked by a red star.
2. **Theoretical Prefetch (Orange Line)**:
- Starts at ~3000 GB/s at x=0.0.
- Declines gradually to ~300 GB/s at x=1.0.
- Slope is less steep than Theoretical Direct Access.
3. **Measured Data Points**:
- **Ours (Blue Dots)**:
- Follows the Theoretical Direct Access line closely but with minor deviations (e.g., ~3000 GB/s at x=0.2 vs. ~3200 GB/s theoretical).
- **SoTA Prefetch System (Orange Crosses)**:
- Tracks the Theoretical Prefetch line but with slight underperformance (e.g., ~2500 GB/s at x=0.2 vs. ~2800 GB/s theoretical).
---
### Key Observations
- **Peak Performance**: Theoretical Direct Access achieves maximum bandwidth (~3500 GB/s) at x=0.1, after which it declines rapidly.
- **Divergence**: Theoretical Direct Access outperforms Prefetch at low offload ratios (x < 0.3), but Prefetch maintains higher bandwidth at higher offload ratios (x > 0.5).
- **Measured vs. Theoretical**: Both "Ours" and "SoTA Prefetch System" align with their theoretical curves but show minor reductions, likely due to real-world overheads.
---
### Interpretation
- **Trade-off Analysis**: The graph highlights a trade-off between offload ratio and bandwidth efficiency. Theoretical Direct Access offers superior bandwidth at low offload ratios but degrades quickly, while Prefetch provides more stable performance at higher offload ratios.
- **Practical Implications**: The measured results ("Ours" and "SoTA Prefetch System") validate the theoretical models but suggest room for optimization to minimize the gap between theory and practice.
- **Anomaly**: The sharp drop in Theoretical Direct Access after x=0.1 indicates a potential bottleneck or inefficiency in memory access patterns at higher offload ratios.
This analysis underscores the importance of balancing offload strategies to maximize system memory bandwidth, with prefetching emerging as a viable alternative for higher offload scenarios.