\n
## Diagram: Math Problem Solving Workflow
### Overview
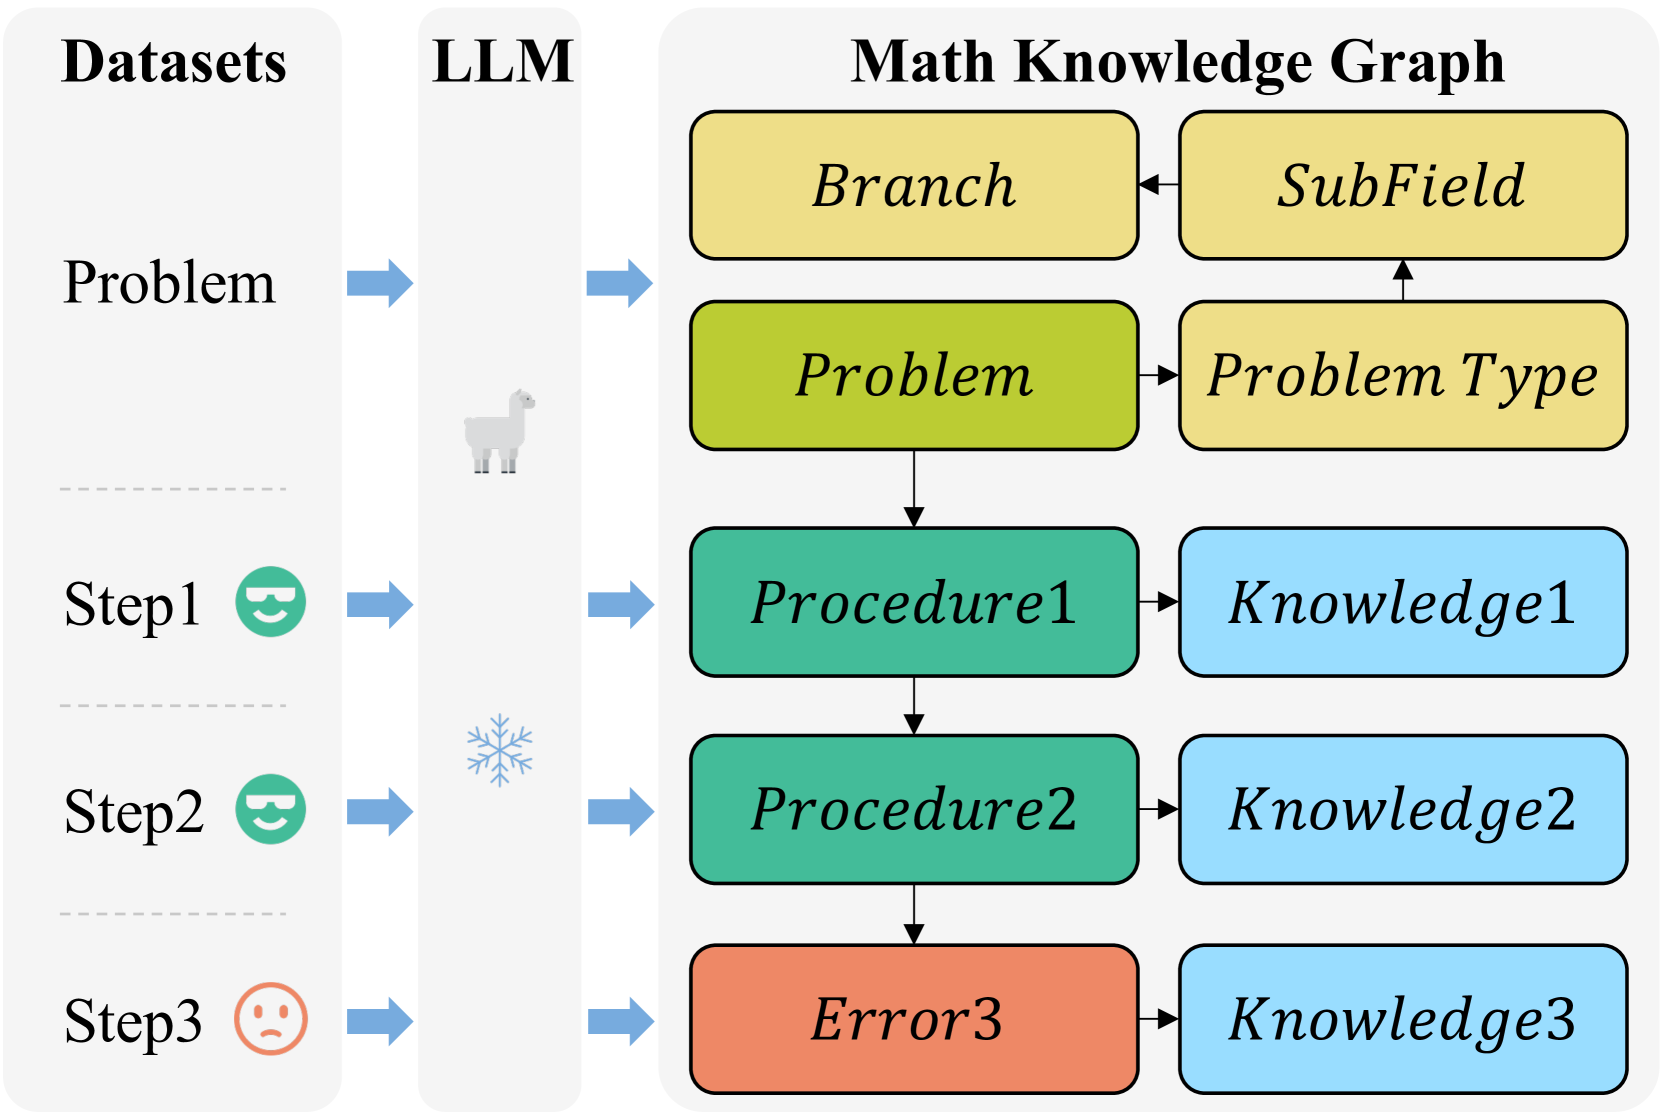
This diagram illustrates a workflow for solving math problems using datasets, a Large Language Model (LLM), and a Math Knowledge Graph. The process begins with a problem from a dataset, which is then processed by the LLM and ultimately interacts with the Math Knowledge Graph to arrive at a solution, potentially identifying errors along the way.
### Components/Axes
The diagram is divided into three main columns: "Datasets", "LLM", and "Math Knowledge Graph". Arrows indicate the flow of information between these components. Within each column, there are multiple steps or nodes.
* **Datasets:** Contains "Problem", "Step1", "Step2", "Step3". Each step is accompanied by an emoji: Step1 (✅), Step2 (✅), Step3 (🙁).
* **LLM:** A central column with an image of a llama. Arrows connect the datasets to the Math Knowledge Graph via the LLM.
* **Math Knowledge Graph:** Contains nodes representing "Branch", "SubField", "Problem", "Problem Type", "Procedure1", "Knowledge1", "Procedure2", "Knowledge2", "Error3", and "Knowledge3".
### Detailed Analysis or Content Details
The diagram shows a sequential process:
1. **Problem Input:** A "Problem" is initially presented from the "Datasets" column.
2. **LLM Processing:** The problem is passed to the "LLM" (represented by a llama image).
3. **Knowledge Graph Interaction - Branch/Subfield:** The LLM interacts with the "Math Knowledge Graph", initially connecting to "Branch" and "SubField" nodes.
4. **Problem Identification:** The LLM then identifies the "Problem" and its "Problem Type" within the Knowledge Graph.
5. **Step 1 Processing:** "Step1" from the "Datasets" column is processed by the LLM, leading to "Procedure1" and "Knowledge1" in the Knowledge Graph. Step1 is marked with a checkmark emoji (✅).
6. **Step 2 Processing:** "Step2" from the "Datasets" column is processed by the LLM, leading to "Procedure2" and "Knowledge2" in the Knowledge Graph. Step2 is marked with a checkmark emoji (✅).
7. **Step 3 Processing & Error Detection:** "Step3" from the "Datasets" column is processed by the LLM, leading to "Error3" and "Knowledge3" in the Knowledge Graph. Step3 is marked with a frowning face emoji (🙁), indicating a potential error.
The arrows indicate a unidirectional flow of information from left to right. The nodes in the "Math Knowledge Graph" are rectangular with rounded corners. The color of the nodes varies: green for successful steps ("Problem", "Procedure1", "Procedure2"), and red for error identification ("Error3"). The "Branch" and "SubField" nodes are yellow.
### Key Observations
* The diagram highlights a potential error detection mechanism in "Step3".
* The LLM acts as an intermediary between the datasets and the Math Knowledge Graph.
* The Knowledge Graph appears to be structured hierarchically, with "Branch" and "SubField" at the top level, followed by "Problem" and "Problem Type", and then "Procedure/Error" and "Knowledge".
* The use of emojis provides a quick visual indication of the success or failure of each step.
### Interpretation
This diagram illustrates a system designed to solve math problems by leveraging the reasoning capabilities of an LLM and the structured knowledge within a Math Knowledge Graph. The workflow suggests that the LLM not only uses the Knowledge Graph to find relevant information but also to validate its reasoning process. The inclusion of "Error3" suggests that the system is capable of identifying and flagging potential errors in its solution path. The emojis are a simple but effective way to communicate the status of each step in the process. The diagram implies a feedback loop where the LLM's interaction with the Knowledge Graph can lead to error detection and refinement of the solution. The overall system aims to combine the flexibility of LLMs with the reliability of structured knowledge representation.