## Diagram: LLM-Based Math Problem Solving and Knowledge Graph Construction
### Overview
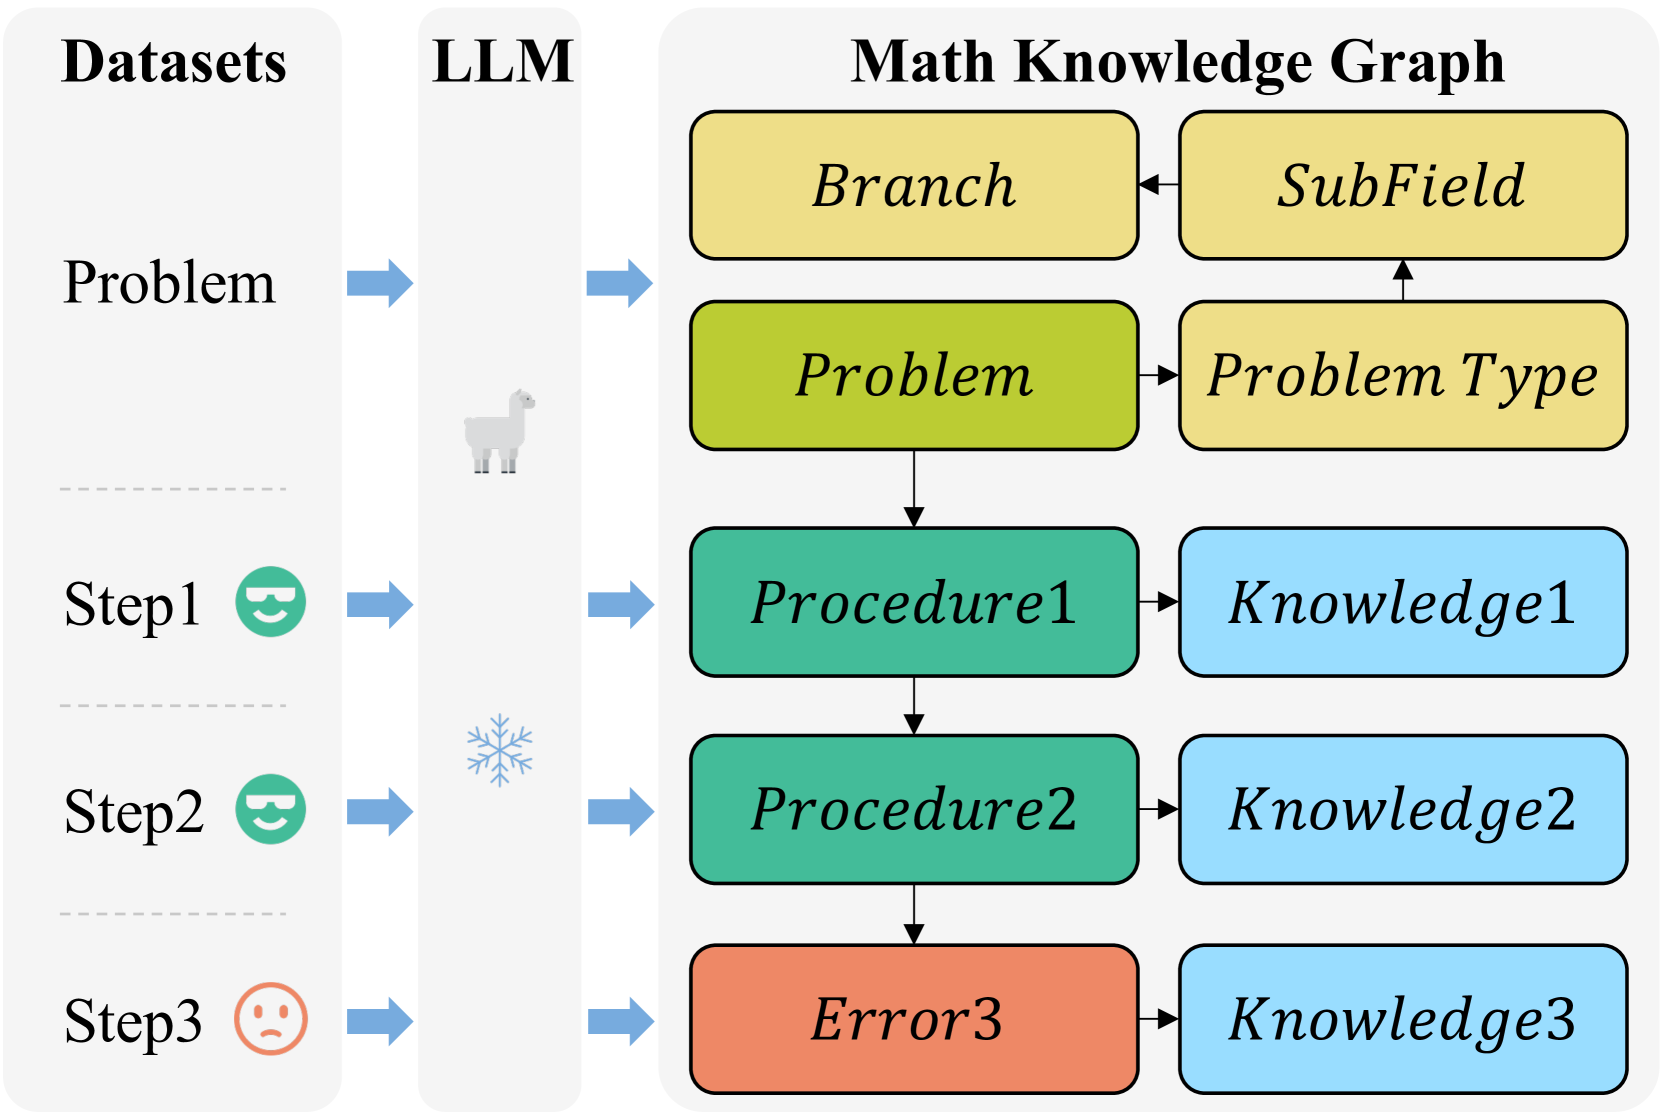
This diagram illustrates a system architecture or workflow where mathematical problems from datasets are processed by a Large Language Model (LLM) to populate and interact with a structured "Math Knowledge Graph." The flow moves from left to right, showing how problem-solving steps and outcomes are mapped to different components of the knowledge graph.
### Components/Axes
The diagram is organized into three vertical columns or regions:
1. **Left Column: Datasets**
* **Header:** "Datasets"
* **Content:** A vertical list of items, each representing an input or stage.
* "Problem" (top item)
* "Step1" (accompanied by a green smiling face icon)
* "Step2" (accompanied by a green smiling face icon)
* "Step3" (accompanied by an orange frowning face icon)
* **Visual Structure:** Items are separated by faint horizontal dashed lines.
2. **Middle Column: LLM**
* **Header:** "LLM"
* **Content:** This column acts as a processing unit. It contains two icons:
* A gray llama icon (positioned between the "Problem" and "Step1" inputs).
* A blue snowflake icon (positioned between the "Step1" and "Step2" inputs).
* **Flow:** Blue arrows point from each item in the "Datasets" column into the "LLM" column, and then from the "LLM" column into the "Math Knowledge Graph" column.
3. **Right Column: Math Knowledge Graph**
* **Header:** "Math Knowledge Graph"
* **Content:** A network of colored, rounded rectangular nodes connected by black arrows, indicating relationships and flow.
* **Node Types & Colors:**
* **Yellow Nodes:** "Branch", "SubField", "Problem Type"
* **Green Nodes:** "Problem", "Procedure1", "Procedure2"
* **Blue Nodes:** "Knowledge1", "Knowledge2", "Knowledge3"
* **Orange Node:** "Error3"
* **Spatial Layout & Connections (Top to Bottom):**
* **Top Tier:** "Branch" (left) and "SubField" (right) are connected by a left-pointing arrow from "SubField" to "Branch".
* **Second Tier:** "Problem" (left) points right to "Problem Type". "Problem Type" points up to "SubField".
* **Third Tier:** "Problem" points down to "Procedure1". "Procedure1" points right to "Knowledge1".
* **Fourth Tier:** "Procedure1" points down to "Procedure2". "Procedure2" points right to "Knowledge2".
* **Fifth Tier:** "Procedure2" points down to "Error3". "Error3" points right to "Knowledge3".
### Detailed Analysis
* **Flow of Information:** The primary flow is horizontal (Datasets -> LLM -> Knowledge Graph) and vertical within the Knowledge Graph (cascading from Problem down through Procedures to an Error).
* **Problem Processing:** A "Problem" from the datasets is sent to the LLM. The LLM's processing (symbolized by the llama and snowflake icons) results in an update or query to the Knowledge Graph, specifically linking the "Problem" node to a "Problem Type" and initiating a procedural chain.
* **Procedural Chain:** The "Problem" leads to "Procedure1", which is associated with "Knowledge1". "Procedure1" leads to "Procedure2", associated with "Knowledge2". This suggests a step-by-step solution process.
* **Error Handling:** The chain culminates in "Error3" (colored orange, indicating a problem or failure state), which is linked to "Knowledge3". This implies that errors are also captured as valuable knowledge within the graph.
* **Hierarchical Classification:** The "Problem Type" is linked upward to "SubField", which is linked to "Branch", showing a taxonomic classification of the problem within mathematics.
### Key Observations
1. **Icon Semantics:** The green smiling faces next to "Step1" and "Step2" likely indicate successful or correct steps, while the orange frowning face next to "Step3" indicates an incorrect step or error. This aligns with the final node being "Error3".
2. **Color Coding:** Colors are used systematically to categorize node types in the Knowledge Graph: yellow for classification/taxonomy, green for active problem-solving elements, blue for knowledge units, and orange for errors.
3. **Dual Input to LLM:** The LLM receives both the initial "Problem" and subsequent "Steps". The snowflake icon between Step1 and Step2 might indicate a different processing mode (e.g., a "frozen" or reference state) compared to the initial processing (llama icon).
4. **Knowledge from Errors:** A significant observation is that "Error3" is explicitly linked to "Knowledge3", suggesting the system is designed to learn from mistakes and incorporate them into the knowledge base.
### Interpretation
This diagram depicts a framework for **structured mathematical reasoning and knowledge acquisition**. It goes beyond simple problem-solving by:
* **Contextualizing Problems:** It automatically classifies a problem into a mathematical taxonomy (Branch -> SubField -> Problem Type).
* **Modeling the Solution Process:** It breaks down solving into discrete, traceable procedures (Procedure1, Procedure2), each linked to specific knowledge components.
* **Valuing Negative Results:** It treats errors not as dead ends but as critical sources of new knowledge ("Knowledge3"), which is a sophisticated approach to machine learning and knowledge graph refinement.
* **Integrating an LLM as a Reasoning Engine:** The LLM acts as the translator between unstructured problem data/step attempts and the structured knowledge graph, performing both classification and procedural generation.
The overall system aims to create a self-improving loop where solving problems (and making errors) enriches a formal knowledge graph, which in turn can guide future problem-solving. The spatial flow from left (raw data) to right (structured knowledge) visually reinforces this transformation of information.