## Chart: Importance Score vs. Reasoning Step
### Overview
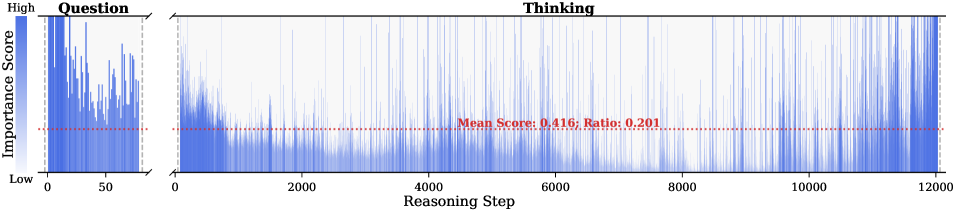
The image presents a chart that visualizes the importance score during a reasoning process. The chart is divided into two sections: "Question" and "Thinking." The "Question" section shows the importance score for the initial question, while the "Thinking" section displays the importance score over the reasoning steps. The chart includes a horizontal line indicating the mean score and ratio.
### Components/Axes
* **Title:** Thinking
* **X-axis (Reasoning Step):** Ranges from 0 to 12000, with tick marks at 0, 2000, 4000, 6000, 8000, 10000, and 12000.
* **Y-axis (Importance Score):** Labeled "Importance Score" and ranges from "Low" to "High." A color gradient from light to dark blue indicates the score, with darker blue representing higher importance.
* **Question Section:** A separate section on the left showing the importance score for the initial question. The x-axis ranges from 0 to 50.
* **Mean Score Line:** A horizontal dashed red line indicating the mean score. The value is labeled as "Mean Score: 0.416; Ratio: 0.201".
### Detailed Analysis
* **Question Section:** The importance scores in the "Question" section are generally high, with significant variation. The scores range from approximately 0.2 to 0.9.
* **Thinking Section:**
* The importance scores in the "Thinking" section start high and decrease rapidly in the initial steps (0-2000).
* From step 2000 to 8000, the importance scores fluctuate but remain relatively low, with most values below 0.5.
* From step 8000 to 12000, the importance scores increase again, showing more frequent peaks.
* The mean score line is at approximately 0.4.
* **Data Representation:** The importance scores are represented by vertical blue lines. The height of each line corresponds to the importance score at that reasoning step.
### Key Observations
* The importance score is high for the initial question and decreases significantly during the initial reasoning steps.
* The importance score fluctuates during the reasoning process, with a general trend of increasing towards the end.
* The mean score provides a baseline for evaluating the importance scores at different reasoning steps.
### Interpretation
The chart suggests that the initial question holds high importance, but as the reasoning process progresses, the importance of individual steps decreases. The increase in importance scores towards the end of the reasoning process may indicate that the later steps are crucial for reaching a conclusion or solution. The mean score serves as a reference point to assess the relative importance of different reasoning steps. The ratio of 0.201 is not clearly defined in the image, but it likely relates to the proportion of steps with high importance scores relative to the total number of steps.