## Bar Chart: First Correct Answer Emergence vs. Number of Samples
### Overview
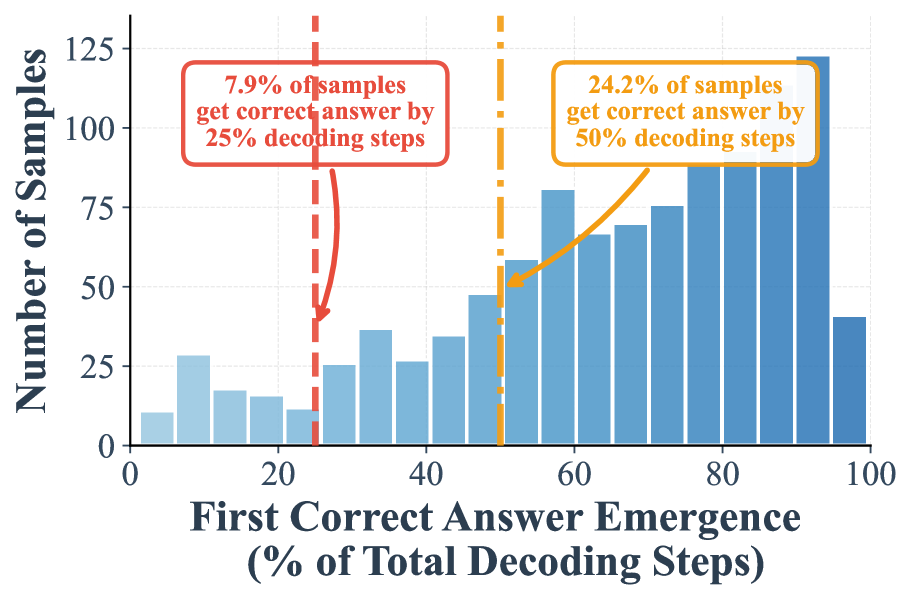
The chart visualizes the relationship between the percentage of total decoding steps required for the first correct answer emergence and the number of samples achieving correctness at specific thresholds. Two vertical dashed lines highlight critical decoding step percentages (25% and 50%), with annotations indicating the proportion of samples achieving correctness by these thresholds. The bars represent the distribution of samples across decoding step percentages, peaking around 80% before declining.
### Components/Axes
- **X-axis**: "First Correct Answer Emergence (% of Total Decoding Steps)" (0–100% range, labeled in increments of 20%).
- **Y-axis**: "Number of Samples" (0–125, labeled in increments of 25).
- **Annotations**:
- **Red Box**: "7.9% of samples get correct answer by 25% decoding steps" (positioned near the 25% threshold).
- **Yellow Box**: "24.2% of samples get correct answer by 50% decoding steps" (positioned near the 50% threshold).
- **Dashed Lines**:
- Red vertical dashed line at 25% decoding steps.
- Yellow vertical dashed line at 50% decoding steps.
- **Bars**: Blue-colored bars represent the number of samples for each decoding step percentage. Heights increase monotonically up to ~80% decoding steps, then decline sharply.
### Detailed Analysis
- **Annotations**:
- At 25% decoding steps: 7.9% of samples achieve correctness.
- At 50% decoding steps: 24.2% of samples achieve correctness.
- **Bar Trends**:
- Bars rise steadily from 0% to ~80% decoding steps, peaking at approximately 100 samples.
- After 80%, bars drop sharply, with the final bar at 100% decoding steps showing ~40 samples.
- **Thresholds**:
- The 25% and 50% decoding steps are marked with vertical dashed lines and annotations, emphasizing their significance.
### Key Observations
1. **Threshold Performance**:
- Only 7.9% of samples achieve correctness by 25% decoding steps, while 24.2% do so by 50%.
- The gap between these thresholds suggests diminishing returns in early decoding steps.
2. **Peak Efficiency**:
- The highest number of samples (near 100) achieves correctness at ~80% decoding steps, indicating an optimal efficiency point.
3. **Decline Post-80%**:
- Performance drops significantly after 80%, with only ~40 samples achieving correctness at 100% decoding steps.
### Interpretation
The data suggests that model performance improves with increased decoding steps but exhibits a critical threshold around 80%, where the majority of samples achieve correctness. The sharp decline post-80% implies potential inefficiencies or instability in further decoding steps. The annotations highlight that early decoding steps (25–50%) capture a small fraction of correct answers, emphasizing the need for deeper processing in most cases. The peak at 80% may reflect a balance between computational cost and accuracy, while the post-80% drop could indicate overfitting, noise, or model limitations in handling edge cases. This chart underscores the trade-off between decoding effort and accuracy in sequence generation tasks.