## Bar Chart: First Correct Answer Emergence
### Overview
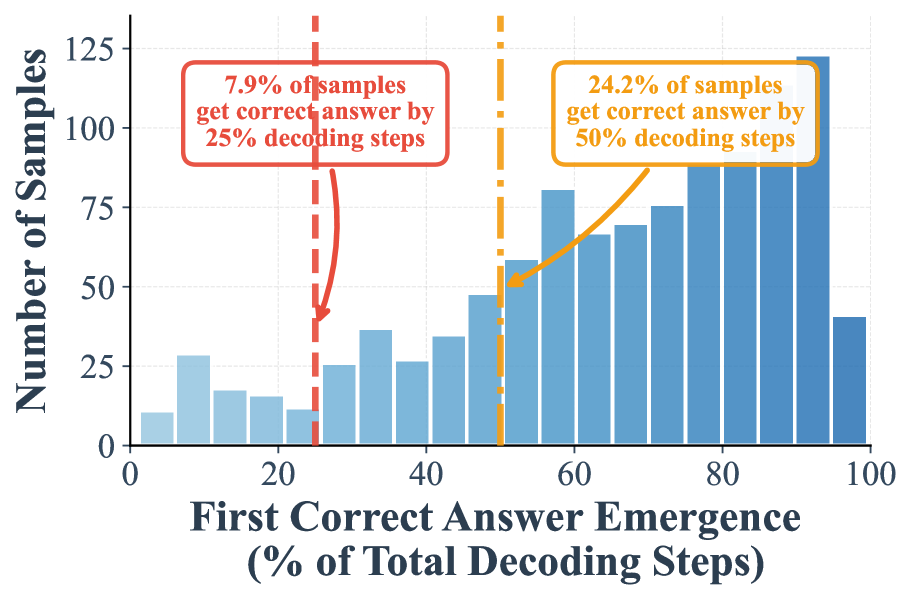
The image is a bar chart illustrating the distribution of the "First Correct Answer Emergence" as a percentage of total decoding steps. The chart shows the number of samples that achieve a correct answer at different percentages of decoding steps. Two vertical lines highlight specific points: 25% and 50% decoding steps, with annotations indicating the percentage of samples that get the correct answer at or before these points.
### Components/Axes
* **Y-axis:** "Number of Samples", ranging from 0 to 125 in increments of 25.
* **X-axis:** "First Correct Answer Emergence (% of Total Decoding Steps)", ranging from 0 to 100 in increments of 20.
* **Bars:** Blue bars representing the number of samples for each percentage range of decoding steps. The bars are lighter blue on the left side of the chart and transition to a darker blue on the right side.
* **Vertical Lines:**
* A red dashed vertical line at 25% decoding steps.
* An orange dashed vertical line at 50% decoding steps.
* **Annotations:**
* A red box with text: "7.9% of samples get correct answer by 25% decoding steps". An arrow points from the box to the red vertical line.
* An orange box with text: "24.2% of samples get correct answer by 50% decoding steps". An arrow points from the box to the orange vertical line.
### Detailed Analysis
The bar chart shows the distribution of the first correct answer emergence. The x-axis represents the percentage of total decoding steps, and the y-axis represents the number of samples.
Here's a breakdown of the approximate bar heights at different percentage ranges:
* **0-10%:** Approximately 12 samples
* **10-20%:** Approximately 22 samples
* **20-30%:** Approximately 30 samples
* **30-40%:** Approximately 20 samples
* **40-50%:** Approximately 35 samples
* **50-60%:** Approximately 55 samples
* **60-70%:** Approximately 65 samples
* **70-80%:** Approximately 85 samples
* **80-90%:** Approximately 80 samples
* **90-100%:** Approximately 40 samples
The annotations indicate that 7.9% of samples get the correct answer by 25% decoding steps, and 24.2% of samples get the correct answer by 50% decoding steps.
### Key Observations
* The number of samples getting the correct answer increases as the percentage of decoding steps increases, peaking between 70% and 80%.
* A significant portion of samples (24.2%) get the correct answer by 50% decoding steps.
* The distribution is skewed towards the right, indicating that most samples require a larger percentage of decoding steps to arrive at the correct answer.
### Interpretation
The data suggests that the model or system being analyzed typically requires a significant portion of the total decoding steps to produce the correct answer. While a small percentage of samples achieve the correct answer early on (7.9% by 25% decoding steps), the majority require more steps. The peak between 70% and 80% indicates that this range is where the highest number of samples first achieve the correct answer. The fact that 24.2% of samples are correct by 50% decoding steps suggests that there's a notable group that finds the solution relatively early, but the overall distribution indicates a general need for more decoding steps. This could be due to the complexity of the problem, the nature of the decoding algorithm, or the characteristics of the samples themselves.