\n
## Histogram: First Correct Answer Emergence
### Overview
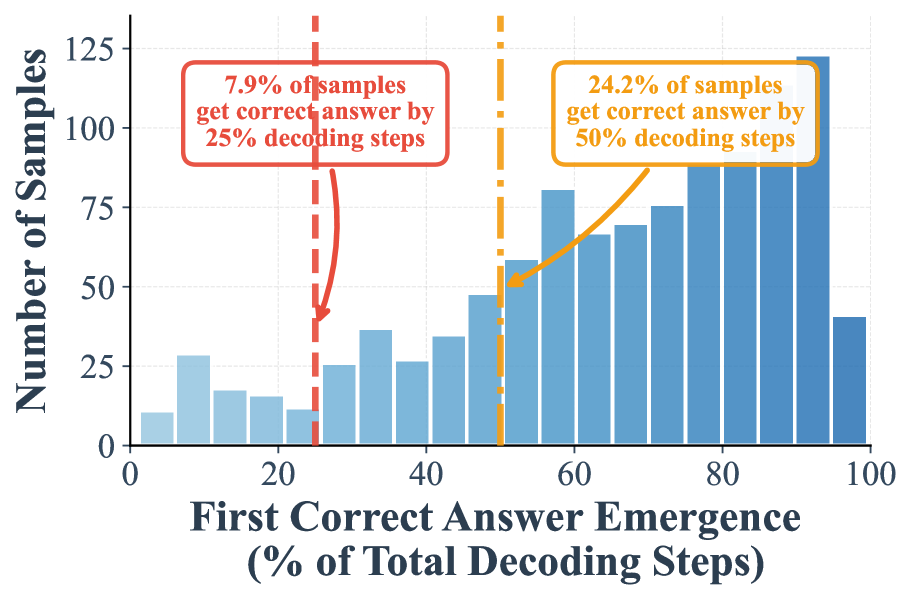
The image presents a histogram illustrating the distribution of the percentage of total decoding steps required for the first correct answer to emerge across a set of samples. The x-axis represents the percentage of total decoding steps, ranging from 0% to 100%, while the y-axis represents the number of samples. The histogram is annotated with two vertical lines and corresponding text boxes highlighting key percentiles.
### Components/Axes
* **X-axis Title:** "First Correct Answer Emergence (% of Total Decoding Steps)"
* **Y-axis Title:** "Number of Samples"
* **X-axis Scale:** Linear, from 0 to 100, with increments of 10.
* **Y-axis Scale:** Linear, from 0 to 125, with increments of 25.
* **Annotation 1:** A red dashed vertical line at approximately 20% with a text box stating "7.9% of samples get correct answer by 25% decoding steps".
* **Annotation 2:** An orange dashed vertical line at approximately 50% with a text box stating "24.2% of samples get correct answer by 50% decoding steps".
* **Annotation 3:** A curved black line pointing to the peak of the distribution, with a yellow text box stating "24.2% of samples get correct answer by 50% decoding steps".
### Detailed Analysis
The histogram shows a distribution that is skewed to the right. The number of samples is low for decoding steps between 0% and 20%. The number of samples increases from approximately 20% to 60%, peaking around 60-70%. After 70%, the number of samples gradually decreases.
Here's a breakdown of approximate sample counts for each 10% interval:
* 0-10%: ~5 samples
* 10-20%: ~12 samples
* 20-30%: ~20 samples
* 30-40%: ~30 samples
* 40-50%: ~40 samples
* 50-60%: ~60 samples
* 60-70%: ~75 samples
* 70-80%: ~70 samples
* 80-90%: ~50 samples
* 90-100%: ~30 samples
### Key Observations
* The distribution is not symmetrical.
* The majority of samples require more than 50% of the decoding steps to produce a correct answer.
* A small percentage of samples (7.9%) achieve a correct answer within the first 25% of decoding steps.
* Approximately 24.2% of samples achieve a correct answer within the first 50% of decoding steps.
* The peak of the distribution is between 60% and 70%, indicating that this is the most common range for the first correct answer to emerge.
### Interpretation
The data suggests that the process of obtaining a correct answer is not immediate and often requires a significant portion of the total decoding steps. The right skew indicates that there's a tail of samples that require a very high percentage of decoding steps to arrive at a correct answer. The annotations highlight key milestones: the percentage of samples that achieve a correct answer relatively quickly (within 25% and 50% of decoding steps) and the peak of the distribution. This could be indicative of the complexity of the decoding process, where initial steps may not be sufficient to identify the correct answer, and a substantial amount of processing is needed. The fact that the peak is around 60-70% suggests that, for most samples, the correct answer emerges after a considerable amount of decoding has been performed. The data could be used to evaluate the efficiency of the decoding algorithm or to identify areas for improvement.