## Scatter Plot: Attention Output with and without Meaningless Tokens
### Overview
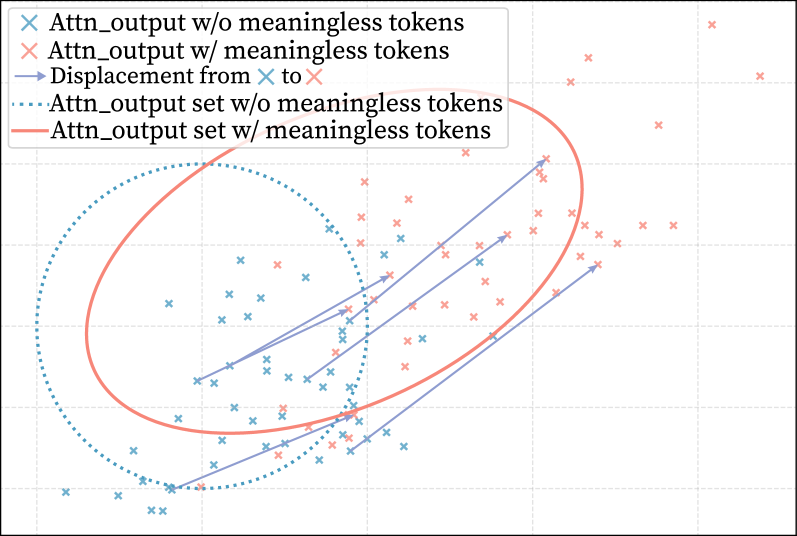
The image is a scatter plot visualizing the attention output of a model, comparing scenarios with and without meaningless tokens. The plot shows the distribution of data points, their displacement, and the boundaries of sets.
### Components/Axes
* **Data Points:**
* Light Blue "x": `Attn_output w/o meaningless tokens`
* Light Red "x": `Attn_output w/ meaningless tokens`
* **Displacement Arrows:** Blue arrows indicating the displacement from a light blue "x" to a light red "x".
* **Set Boundaries:**
* Dotted Light Blue Line: `Attn_output set w/o meaningless tokens` (forms a circle)
* Solid Light Red Line: `Attn_output set w/ meaningless tokens` (forms an oval)
* **Grid:** The background has a faint grid for visual reference.
### Detailed Analysis
* **Attn_output w/o meaningless tokens (Light Blue "x"):** These points are concentrated more towards the lower-left quadrant of the plot, with a higher density inside the dotted light blue circle.
* **Attn_output w/ meaningless tokens (Light Red "x"):** These points are more dispersed across the plot, with a higher concentration outside the dotted light blue circle and along the solid light red oval.
* **Displacement Arrows (Blue):** The arrows generally point from the lower-left towards the upper-right, indicating a shift in attention output when meaningless tokens are included.
* **Attn_output set w/o meaningless tokens (Dotted Light Blue Circle):** This circle encompasses a significant portion of the light blue "x" data points, suggesting that the attention output without meaningless tokens is more constrained within this region. The approximate center of the circle is near the center-left of the plot.
* **Attn_output set w/ meaningless tokens (Solid Light Red Oval):** This oval encloses a larger area than the circle and appears to capture the spread of the light red "x" data points. The oval extends from the lower-left to the upper-right of the plot.
### Key Observations
* The inclusion of meaningless tokens leads to a wider distribution of attention outputs.
* The displacement arrows indicate a systematic shift in attention when meaningless tokens are present.
* The sets defined by the circle and oval visually separate the two conditions (with and without meaningless tokens).
### Interpretation
The plot suggests that meaningless tokens significantly alter the attention output of the model. The shift in data point distribution, as visualized by the displacement arrows and the different set boundaries, indicates that the model's attention mechanism is affected by the presence of these tokens. The concentration of light blue "x" points within the dotted light blue circle suggests that removing meaningless tokens leads to a more focused and constrained attention output. The light red oval shows the boundary of the attention output when meaningless tokens are included, which is more dispersed.