\n
## Diagram: Causal Models and Semi-Algebraic Sets
### Overview
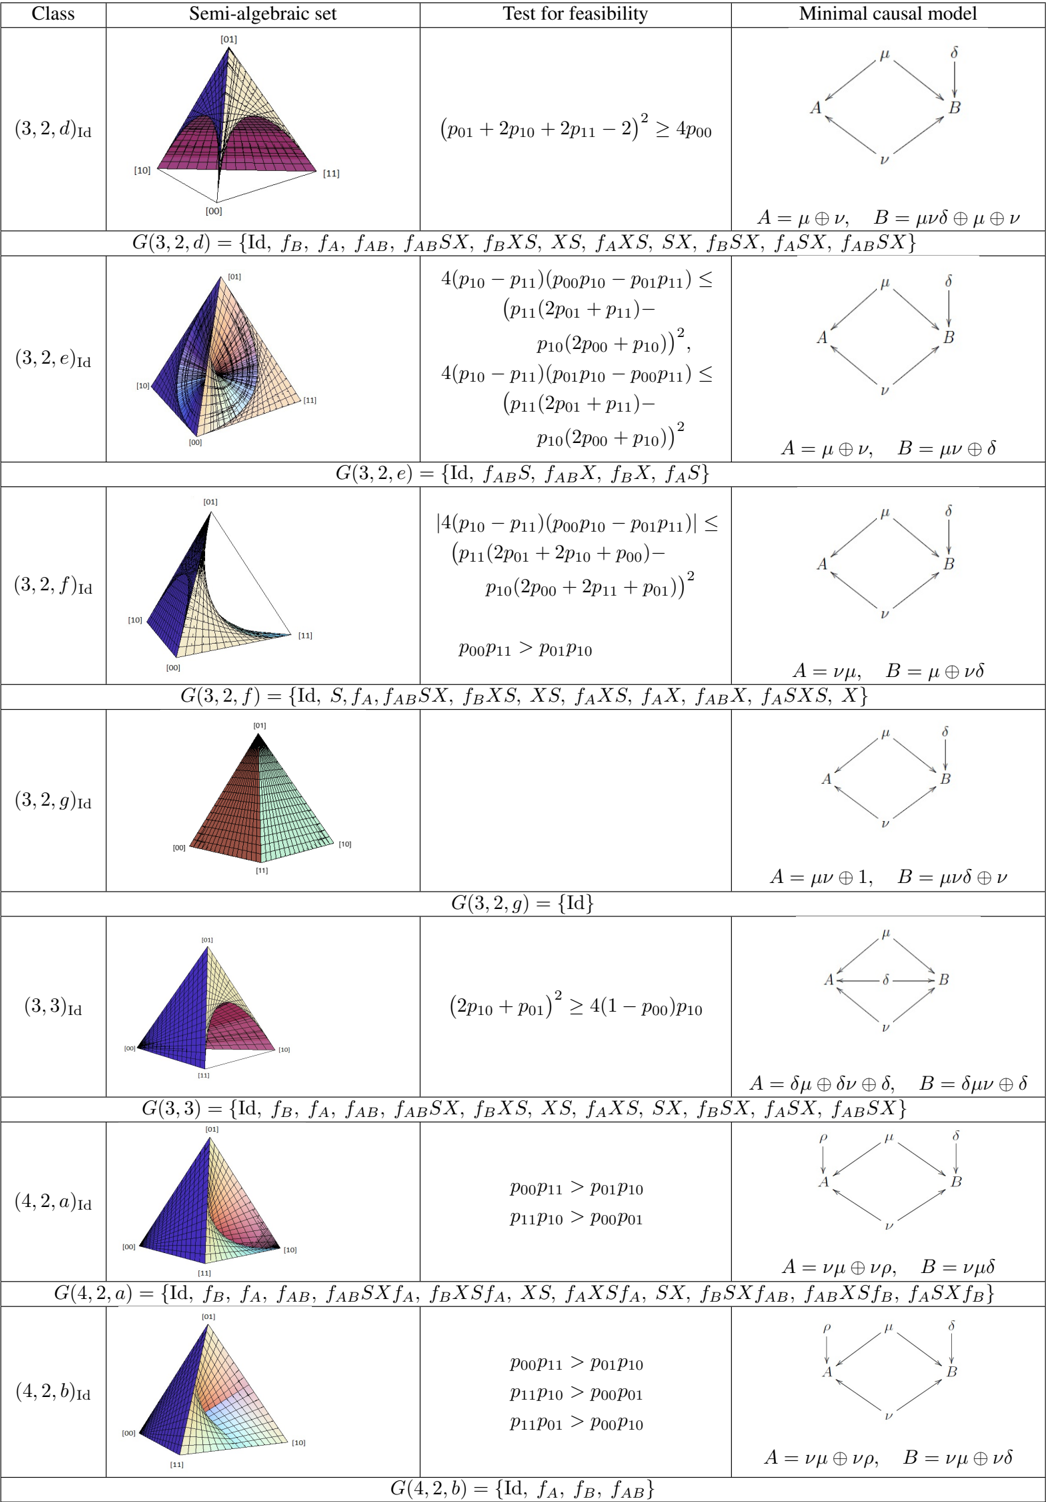
The image presents a series of diagrams illustrating different causal models alongside their corresponding semi-algebraic sets and tests for feasibility. Each row represents a different class of causal model, visually depicting the model and providing a mathematical test to determine its feasibility. The diagram is organized in a grid-like structure, with each row containing four columns: "Class", "Semi-algebraic set", "Test for feasibility", and "Minimal causal model".
### Components/Axes
The diagram consists of the following components:
* **Class:** Labels indicating the type of causal model (e.g., (3,2,d)₁ₐ, (3,3)₁ₐ, (4,2,a)₁ₐ).
* **Semi-algebraic set:** 3D plots representing the semi-algebraic set associated with each causal model. The axes of these plots are labeled [100], [110], and [111].
* **Test for feasibility:** Mathematical inequalities that must be satisfied for the corresponding causal model to be feasible.
* **Minimal causal model:** Diagrams illustrating the causal relationships between variables A and B, with arrows indicating the direction of causality. The variables A and B are often expressed in terms of μ and ν, and δ.
### Detailed Analysis / Content Details
Here's a breakdown of each row, extracting the key information:
**1. (3,2,d)₁ₐ**
* **Semi-algebraic set:** 3D plot with axes [100], [110], [111].
* **Test for feasibility:** (p₀₁ + 2p₁₀ + 2p₁₁) ² ≥ 4p₀₀
* **Minimal causal model:** A → B, where A = μν, B = μνδ
**2. (3,2,e)₁ₐ**
* **Semi-algebraic set:** 3D plot with axes [100], [110], [111].
* **Test for feasibility:** 4(p₁₀ - p₁₁)(p₀₀p₁₀ - p₀₁p₁₁) ≤ (p₁₁(2p₀₁ + p₁₁) - p₁₀(2p₀₀ + p₁₀))²
* **Minimal causal model:** A → B, where A = μ + ∅, B = μν + δ
**3. (3,2,f)₁ₐ**
* **Semi-algebraic set:** 3D plot with axes [100], [110], [111].
* **Test for feasibility:** [4(p₁₀ - p₁₁)(p₀₀p₁₀ - p₀₁p₁₁)]² ≤ (p₁₁(2p₀₁ + 2p₁₀ + p₁₁) - p₁₀(2p₀₀ + p₁₀))²
* **Minimal causal model:** A → B, where A = νμ, B = μνδ
**4. (3,2,g)₁ₐ**
* **Semi-algebraic set:** 3D plot with axes [100], [110], [111].
* **Test for feasibility:** p₀₀p₁₁ > p₀₁p₁₀
* **Minimal causal model:** A → B, where A = μ + 1, B = μνδ + ν
**5. (3,3)₁ₐ**
* **Semi-algebraic set:** 3D plot with axes [100], [110], [111].
* **Test for feasibility:** (2p₁₀ + 2p₁₁) ² ≥ 4(1 - p₀₀)p₁₀
* **Minimal causal model:** A ↔ B, where A = δμ + δν, B = δμν + δ
**6. (4,2,a)₁ₐ**
* **Semi-algebraic set:** 3D plot with axes [100], [110], [111].
* **Test for feasibility:** p₁₁ > p₀₁
* **Minimal causal model:** A → B, where A = νμ + γ, B = μνδ + γ
**7. (4,2,a)₁ₐ**
* **Semi-algebraic set:** 3D plot with axes [100], [110], [111].
* **Test for feasibility:** p₁₁ > p₀₁
* **Minimal causal model:** A → B, where A = νμ + γ, B = μνδ + γ
### Key Observations
* The semi-algebraic sets are consistently represented as 3D plots with the same axes ([100], [110], [111]).
* The tests for feasibility are mathematical inequalities involving probabilities (p₀₀, p₀₁, p₁₀, p₁₁).
* The minimal causal models are simple diagrams showing the relationship between variables A and B, often involving bidirectional or unidirectional causality.
* The variables A and B are frequently expressed in terms of μ, ν, δ, and γ.
* The notation "₁ₐ" appears consistently after the class label, potentially indicating a specific parameterization or condition.
### Interpretation
This diagram explores the relationship between causal models, their geometric representation as semi-algebraic sets, and the mathematical conditions required for their feasibility. Each row represents a specific causal structure, and the diagram demonstrates how to translate that structure into a mathematical test. The 3D plots likely visualize the space of possible probability distributions that satisfy the causal constraints.
The tests for feasibility provide a way to determine whether a given causal model is consistent with observed data. The minimal causal models offer a simplified representation of the causal relationships, highlighting the essential connections between variables.
The consistent use of variables like μ, ν, and δ suggests a common underlying framework for representing these causal models. The notation "₁ₐ" might indicate a specific assumption or constraint within that framework. The diagram serves as a visual and mathematical tool for understanding and analyzing causal relationships in probabilistic systems. The diagram is a theoretical exploration of causal inference, and does not present empirical data. It is a demonstration of the mathematical relationships between causal structures and their feasibility conditions.