## Line Graph: Generalized Soft Bounds Device Model
### Overview
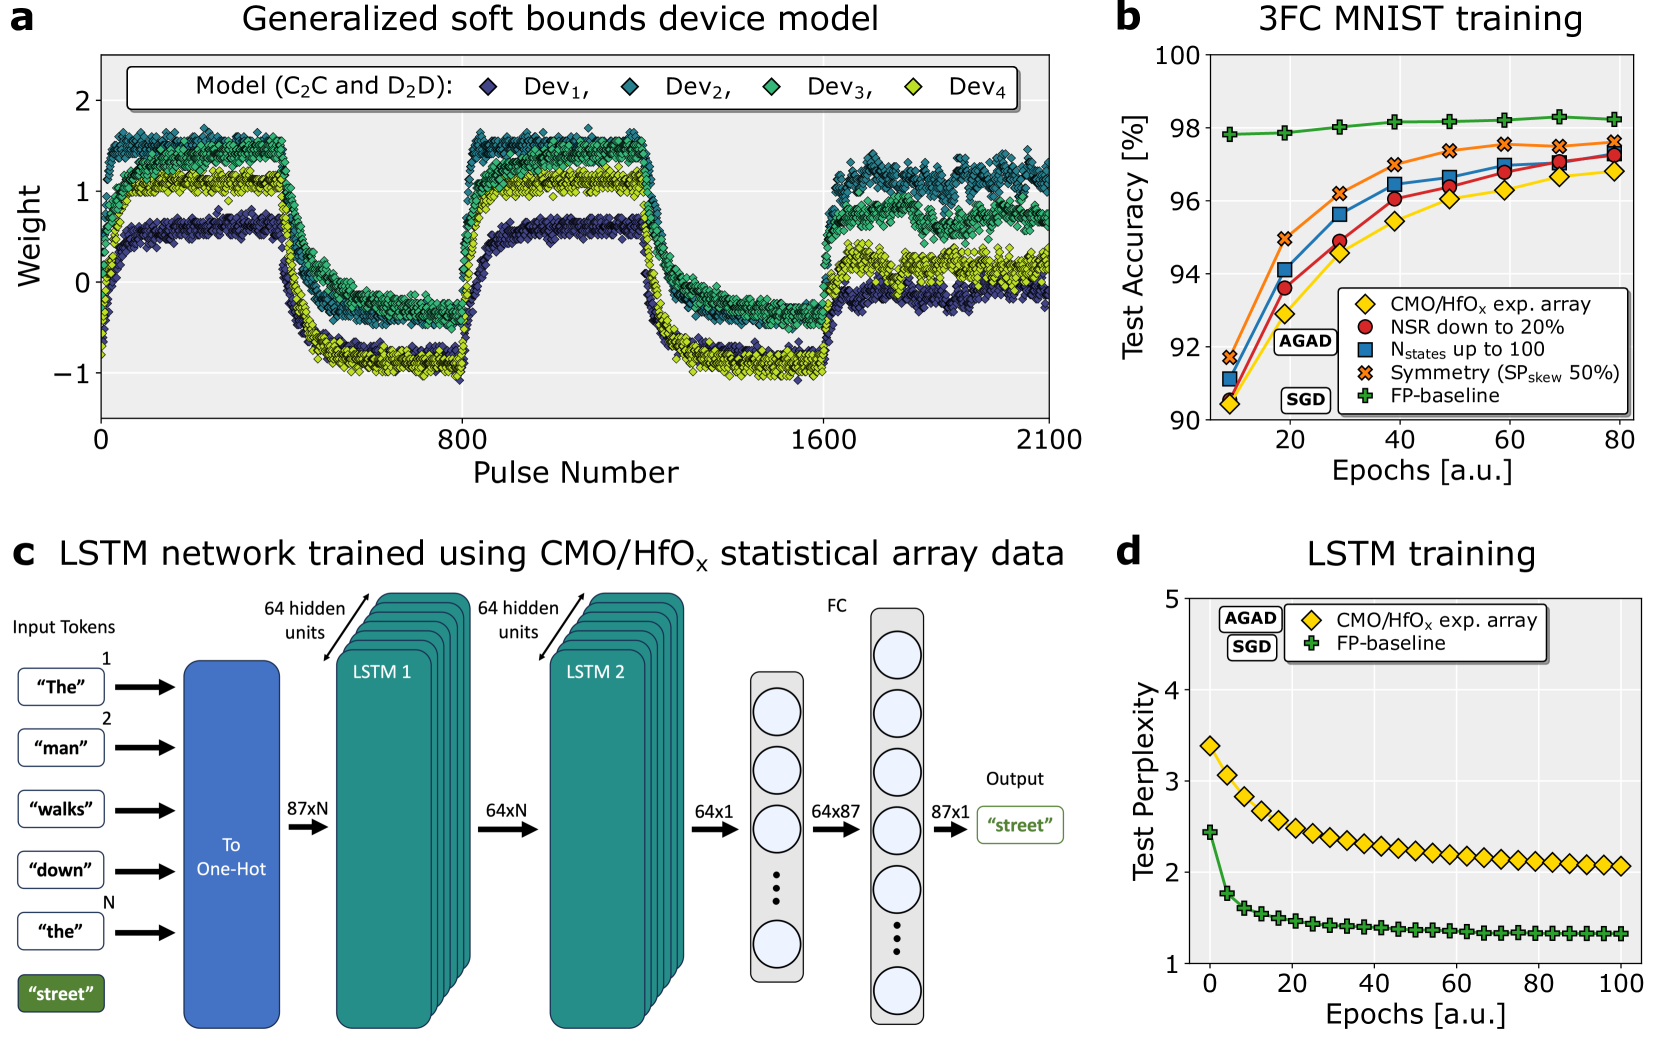
A line graph showing weight fluctuations across four devices (Dev1–Dev4) over 2100 pulses. The y-axis ranges from -1 to 2, with overlapping lines indicating device-specific weight variations.
### Components/Axes
- **X-axis**: Pulse Number (0–2100)
- **Y-axis**: Weight (-1 to 2)
- **Legend**:
- Dev1: Dark blue diamonds
- Dev2: Teal diamonds
- Dev3: Green diamonds
- Dev4: Yellow diamonds
### Detailed Analysis
- **Dev1 (Dark Blue)**: Starts at ~1.5, dips to ~0.5 at pulse 800, then rises to ~1.8 by pulse 2100.
- **Dev2 (Teal)**: Peaks at ~1.8 near pulse 0, drops to ~0.2 at pulse 800, then stabilizes at ~1.6.
- **Dev3 (Green)**: Begins at ~1.2, fluctuates between ~0.8 and ~1.5, ending at ~1.4.
- **Dev4 (Yellow)**: Starts at ~0.9, dips to ~0.3 at pulse 800, then rises to ~1.3.
### Key Observations
- All devices exhibit periodic dips around pulse 800.
- Dev1 and Dev2 show the most pronounced fluctuations.
- Dev4 has the smallest amplitude in weight changes.
### Interpretation
The graph suggests device-specific weight dynamics under a generalized model. The synchronized dip at pulse 800 may indicate a shared response to a stimulus or system reset. Dev1’s final weight (~1.8) implies higher sensitivity compared to others.
---
## Bar Chart: 3FC MNIST Training
### Overview
A bar chart comparing test accuracy (%) of five training methods over 80 epochs. The y-axis ranges from 90% to 100%.
### Components/Axes
- **X-axis**: Epochs (0–80, labeled "a.u.")
- **Y-axis**: Test Accuracy (%)
- **Legend**:
- CMO/HFOₓ exp. array: Yellow diamonds
- NSR down to 20%: Red circles
- Nstates up to 100: Blue squares
- Symmetry (SP_skew 50%): Orange crosses
- SGD: Green pluses
- FP-baseline: Green pluses (baseline)
### Detailed Analysis
- **CMO/HFOₓ exp. array**: Peaks at ~98% by 80 epochs.
- **NSR down to 20%**: Reaches ~97% by 80 epochs.
- **Nstates up to 100**: Stabilizes at ~96.5%.
- **Symmetry (SP_skew 50%)**: ~97.5% at 80 epochs.
- **SGD**: ~94% at 80 epochs.
- **FP-baseline**: ~98% (constant across epochs).
### Key Observations
- CMO/HFOₓ exp. array and FP-baseline achieve the highest accuracy.
- Symmetry (SP_skew 50%) outperforms Nstates and NSR.
- SGD lags significantly behind other methods.
### Interpretation
CMO/HFOₓ exp. array and FP-baseline demonstrate superior convergence, suggesting robust training dynamics. The FP-baseline’s consistency implies it serves as a strong benchmark. SGD’s lower performance highlights its limitations in this context.
---
## Diagram: LSTM Network Trained Using CMO/HFOₓ Statistical Array Data
### Overview
A block diagram of an LSTM network processing input tokens ("The", "man", "walks", etc.) to output "street".
### Components
1. **Input Layer**:
- Tokens converted to one-hot encoding (87xN).
2. **LSTM Layers**:
- **LSTM1**: 64 hidden units, 87x64xN input.
- **LSTM2**: 64 hidden units, 64x64xN input.
3. **Fully Connected (FC) Layer**: 64x87x1 output.
4. **Output**: "street" (87x1).
### Flow
Input → One-Hot Encoding → LSTM1 → LSTM2 → FC → Output.
### Key Observations
- The network uses two LSTM layers for sequential processing.
- The FC layer maps hidden states to output tokens.
### Interpretation
This architecture is designed for sequence-to-sequence tasks, leveraging LSTM’s memory capabilities. The one-hot encoding ensures discrete token representation, while the FC layer finalizes predictions.
---
## Line Graph: LSTM Training
### Overview
A line graph comparing test perplexity (1–5) of three methods over 100 epochs.
### Components/Axes
- **X-axis**: Epochs (0–100, labeled "a.u.")
- **Y-axis**: Test Perplexity
- **Legend**:
- AGAD: Yellow diamonds
- CMO/HFOₓ exp. array: Orange crosses
- FP-baseline: Green pluses
### Detailed Analysis
- **AGAD**: Starts at ~3.5, decreases to ~2.0 by 100 epochs.
- **CMO/HFOₓ exp. array**: Drops from ~3.0 to ~2.2.
- **FP-baseline**: Remains flat at ~1.2.
### Key Observations
- AGAD shows the steepest decline in perplexity.
- FP-baseline maintains the lowest perplexity throughout.
### Interpretation
AGAD’s rapid improvement suggests effective training dynamics. FP-baseline’s stability indicates it may represent an optimized or pre-trained model. The divergence between AGAD and FP-baseline highlights differences in training strategies.