## Histogram: First Correct Answer Emergence
### Overview
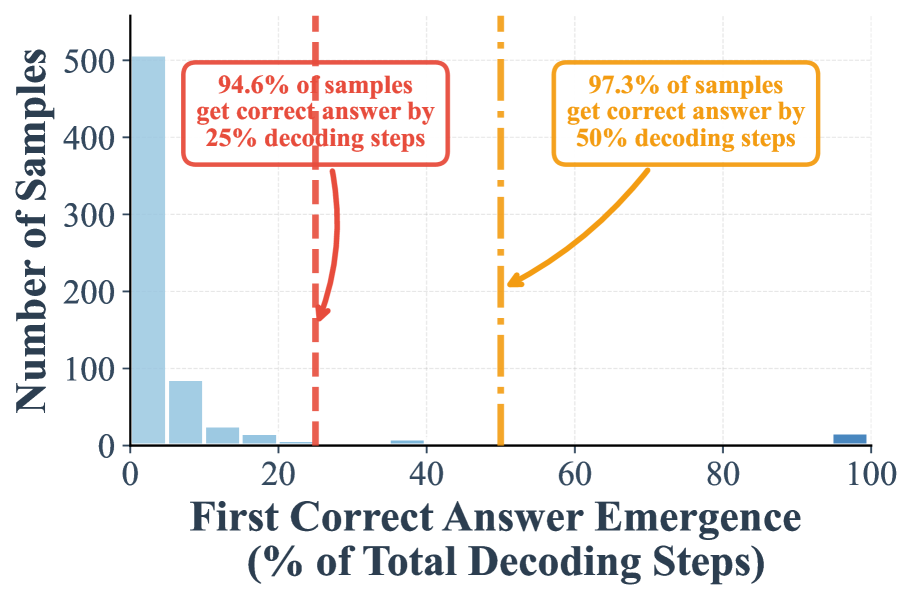
The image is a histogram showing the distribution of the "First Correct Answer Emergence" as a percentage of total decoding steps. It also highlights the percentage of samples that achieve a correct answer by 25% and 50% of the decoding steps.
### Components/Axes
* **X-axis:** "First Correct Answer Emergence (% of Total Decoding Steps)". The scale ranges from 0 to 100, with tick marks at 0, 20, 40, 60, 80, and 100.
* **Y-axis:** "Number of Samples". The scale ranges from 0 to 500, with tick marks at 0, 100, 200, 300, 400, and 500.
* **Bars:** Light blue bars represent the frequency of samples for each percentage range of decoding steps.
* **Vertical Lines:**
* A dashed red vertical line is positioned at approximately 25% on the x-axis.
* A dashed orange vertical line is positioned at approximately 50% on the x-axis.
* **Annotations:**
* A red box states: "94.6% of samples get correct answer by 25% decoding steps". An arrow points from the box to the red vertical line.
* An orange box states: "97.3% of samples get correct answer by 50% decoding steps". An arrow points from the box to the orange vertical line.
### Detailed Analysis
* **Bar at 0%:** The tallest bar is at 0%, indicating that a large number of samples get the correct answer almost immediately. The height of this bar is approximately 500.
* **Bars between 0% and 20%:** The frequency of samples decreases rapidly between 0% and 20%. The bar at 10% is approximately 80.
* **Bars between 20% and 40%:** The frequency of samples continues to decrease, with very few samples getting the correct answer in this range. The bar at 30% is approximately 10.
* **Bars between 40% and 100%:** The frequency of samples remains very low, with a slight increase at 100%. The bar at 100% is approximately 20.
* **Red Vertical Line (25%):** The red dashed line at 25% indicates that 94.6% of samples have found the correct answer by this point.
* **Orange Vertical Line (50%):** The orange dashed line at 50% indicates that 97.3% of samples have found the correct answer by this point.
### Key Observations
* A significant portion of samples (approximately 500) achieve the correct answer almost immediately (0% decoding steps).
* The number of samples that find the correct answer decreases rapidly as the percentage of decoding steps increases.
* By 25% of the decoding steps, the vast majority (94.6%) of samples have found the correct answer.
* By 50% of the decoding steps, an even larger majority (97.3%) of samples have found the correct answer.
### Interpretation
The histogram suggests that the decoding process is highly efficient for most samples. A large number of samples find the correct answer very early in the process. The annotations highlight that the vast majority of samples converge to the correct answer within the first 25% of the decoding steps, with only a small fraction requiring up to 50% of the steps. This indicates that the model or algorithm being analyzed is generally very effective at quickly identifying the correct solution. The rapid decline in the number of samples finding the correct answer after 0% suggests that while many samples are easily decoded, there is a subset that requires more processing, but even these typically converge within a relatively small number of steps.