\n
## Histogram: First Correct Answer Emergence
### Overview
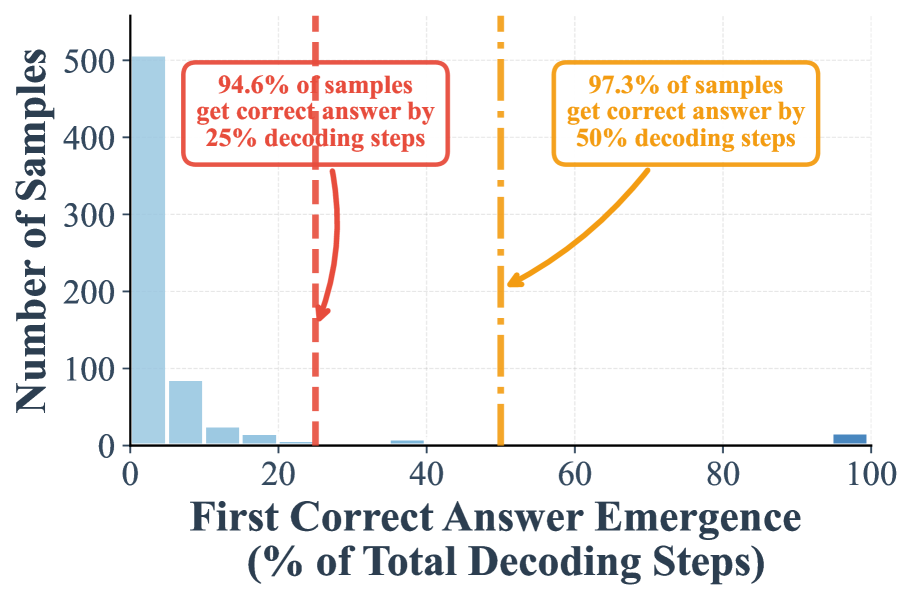
The image presents a histogram illustrating the distribution of the percentage of total decoding steps required for the first correct answer to emerge. The y-axis represents the number of samples, while the x-axis represents the percentage of total decoding steps. Two vertical dashed lines are present, marking 25% and 50% decoding steps, with associated percentages of samples achieving a correct answer by those steps. An orange line plots the cumulative distribution of samples.
### Components/Axes
* **X-axis Title:** "First Correct Answer Emergence (% of Total Decoding Steps)" - Scale ranges from 0 to 100, with markings at 0, 20, 40, 60, 80, and 100.
* **Y-axis Title:** "Number of Samples" - Scale ranges from 0 to 500, with markings at increments of 100.
* **Vertical Dashed Line 1:** Positioned at approximately 25% on the x-axis. Associated text: "94.6% of samples get correct answer by 25% decoding steps". Color: Red.
* **Vertical Dashed Line 2:** Positioned at approximately 50% on the x-axis. Associated text: "97.3% of samples get correct answer by 50% decoding steps". Color: Orange.
* **Orange Line:** Represents the cumulative distribution of samples. Starts near zero, rises gradually, then increases sharply around 50% on the x-axis, and plateaus.
* **Histogram Bars:** Represent the frequency of samples at each percentage of decoding steps.
### Detailed Analysis
The histogram shows a concentration of samples requiring a low percentage of decoding steps to achieve a correct answer.
* **0-10%:** Approximately 50 samples.
* **10-20%:** Approximately 120 samples.
* **20-30%:** Approximately 180 samples.
* **30-40%:** Approximately 100 samples.
* **40-50%:** Approximately 40 samples.
* **50-60%:** Approximately 20 samples.
* **60-70%:** Approximately 10 samples.
* **70-80%:** Approximately 5 samples.
* **80-90%:** Approximately 2 samples.
* **90-100%:** Approximately 5 samples.
The orange cumulative distribution line starts at approximately 0 samples at 0% decoding steps. It increases steadily to approximately 250 samples at 25% decoding steps. It then rises sharply, reaching approximately 485 samples at 50% decoding steps. The line continues to increase, but at a slower rate, reaching approximately 500 samples at 60% decoding steps.
### Key Observations
* The vast majority of samples (94.6%) achieve a correct answer within the first 25% of decoding steps.
* An even higher percentage (97.3%) achieve a correct answer within the first 50% of decoding steps.
* The distribution is heavily skewed towards lower decoding step percentages.
* There is a small tail of samples that require a higher percentage of decoding steps to achieve a correct answer.
### Interpretation
The data suggests that the system under evaluation is highly efficient at generating correct answers, with most answers emerging relatively quickly during the decoding process. The steep increase in the cumulative distribution around 50% indicates a rapid convergence towards correct answers. The small tail of samples requiring more decoding steps may represent more complex or ambiguous cases. The two vertical lines highlight key milestones in the decoding process, demonstrating the percentage of samples that achieve a correct answer within those thresholds. This data could be used to evaluate the performance of a language model or other decoding algorithm, and to identify areas for improvement. The fact that nearly all samples converge to a correct answer by 50% decoding steps suggests a robust and reliable system.