## Chart: NMSE vs. Iterations for LLMSR and PIT-PO
### Overview
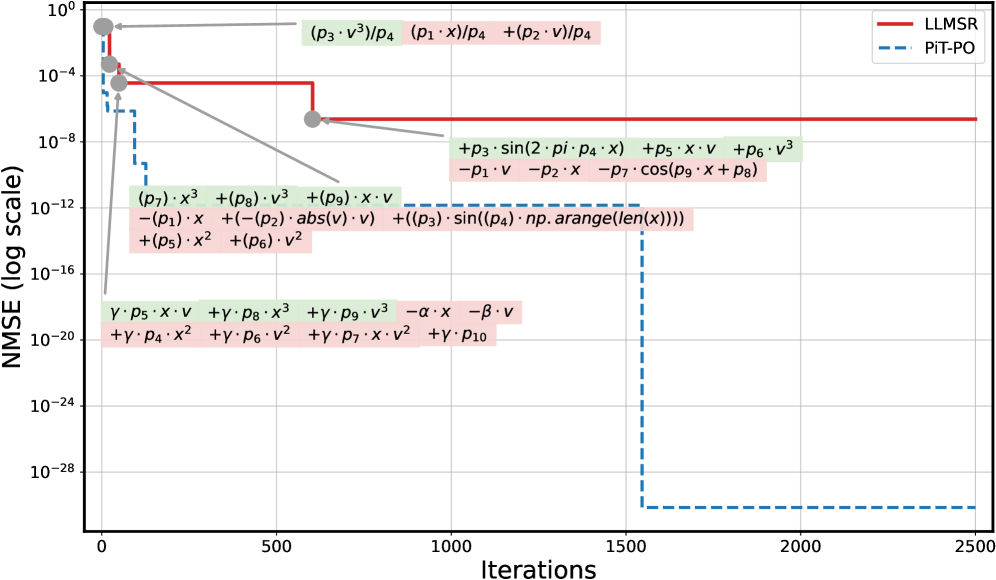
This chart displays the Normalized Mean Squared Error (NMSE) on a logarithmic scale against the number of iterations for two algorithms: LLMSR (Least-squares Locally Linear Model Shrinkage Regression) and PIT-PO (likely an abbreviation for a specific optimization method). The chart aims to demonstrate the convergence of these algorithms, showing how the error decreases with increasing iterations.
### Components/Axes
* **X-axis:** Iterations (linear scale, ranging from 0 to 2500)
* **Y-axis:** NMSE (log scale, ranging from 10<sup>-24</sup> to 10<sup>0</sup>)
* **Legend:**
* LLMSR (solid black line)
* PIT-PO (dashed red line)
* **Annotations:** Equations are displayed above the lines, presumably representing the error function or update rule for each algorithm.
### Detailed Analysis
**LLMSR (Black Solid Line):**
The LLMSR line starts at approximately 8.0 x 10<sup>-8</sup> NMSE at 0 iterations. It exhibits a steep downward slope initially, decreasing rapidly to approximately 1.5 x 10<sup>-12</sup> NMSE at around 500 iterations. The slope becomes less steep between 500 and 1500 iterations, reaching a plateau around 2.0 x 10<sup>-20</sup> NMSE at 1500 iterations. After 1500 iterations, the line shows a sudden drop to approximately 1.0 x 10<sup>-24</sup> NMSE at 1525 iterations, and remains relatively constant thereafter.
**PIT-PO (Red Dashed Line):**
The PIT-PO line begins at approximately 8.0 x 10<sup>-8</sup> NMSE at 0 iterations. It initially decreases at a moderate rate, reaching approximately 1.0 x 10<sup>-10</sup> NMSE at around 500 iterations. Between 500 and 1500 iterations, the line remains relatively flat, fluctuating around 1.0 x 10<sup>-10</sup> NMSE. At approximately 1500 iterations, the line experiences a sharp drop to approximately 1.0 x 10<sup>-24</sup> NMSE, and remains constant thereafter.
**Annotations (Equations):**
* **LLMSR Equation:** (p<sub>3</sub>⋅v<sup>3</sup>)/p<sub>4</sub> - (p<sub>1</sub>⋅x)/p<sub>4</sub> + (p<sub>2</sub>⋅v)/p<sub>4</sub>
* **PIT-PO Equation:** +p<sub>3</sub>⋅sin(2⋅pi⋅x) + p<sub>5</sub>⋅v + p<sub>6</sub>⋅v<sup>3</sup> - p<sub>1</sub>⋅v - p<sub>2</sub>⋅x - p<sub>7</sub>⋅cos(p<sub>9</sub>⋅x + p<sub>8</sub>)
* **LLMSR Equation:** (p<sub>7</sub>⋅x<sup>3</sup> + (p<sub>8</sub>⋅v<sup>3</sup> + (p<sub>9</sub>⋅x⋅v - (p<sub>1</sub>)⋅x +(-(p<sub>2</sub>)⋅abs(v)⋅v) + ((p<sub>3</sub>)⋅sin(p<sub>4</sub>⋅np.arange(len(x)))) + (p<sub>5</sub>)⋅x<sup>2</sup> + (p<sub>6</sub>)⋅v<sup>2</sup>
* **PIT-PO Equation:** γ⋅p<sub>5</sub>⋅x⋅v + γ⋅p<sub>8</sub>⋅x<sup>3</sup> + γ⋅p<sub>9</sub>⋅v<sup>3</sup> - α⋅x - β⋅v + γ⋅p<sub>4</sub>⋅x<sup>2</sup> + γ⋅p<sub>6</sub>⋅v<sup>2</sup> + γ⋅p<sub>7</sub>⋅x⋅v<sup>2</sup> + γ⋅p<sub>10</sub>
### Key Observations
* Both algorithms converge to a very low NMSE (around 10<sup>-24</sup>).
* LLMSR initially converges faster than PIT-PO.
* PIT-PO exhibits a period of stagnation between 500 and 1500 iterations.
* Both algorithms show a sudden drop in NMSE around 1500 iterations, suggesting a significant improvement in the solution at that point.
* The equations provided are complex and likely represent the core calculations within each algorithm.
### Interpretation
The chart demonstrates the effectiveness of both LLMSR and PIT-PO in minimizing the NMSE. The logarithmic scale highlights the substantial reduction in error achieved by both methods. The initial faster convergence of LLMSR suggests it might be more efficient for the first few iterations. However, both algorithms ultimately reach a similar level of accuracy. The stagnation observed in PIT-PO between 500 and 1500 iterations could indicate a challenging region in the optimization landscape, or a need for parameter tuning. The sudden drop in NMSE around 1500 iterations for both algorithms could be due to a change in the optimization strategy, or the algorithm overcoming a local minimum. The provided equations offer insight into the mathematical foundations of each algorithm, but a deeper understanding would require further analysis of the parameters (p<sub>1</sub>, p<sub>2</sub>, etc.) and their roles in the calculations. The chart suggests that both algorithms are viable options for minimizing the NMSE, but their performance characteristics differ, and the choice between them might depend on the specific application and computational constraints.