## Line Chart: Mathematical Function Plot C(S(3,l))
### Overview
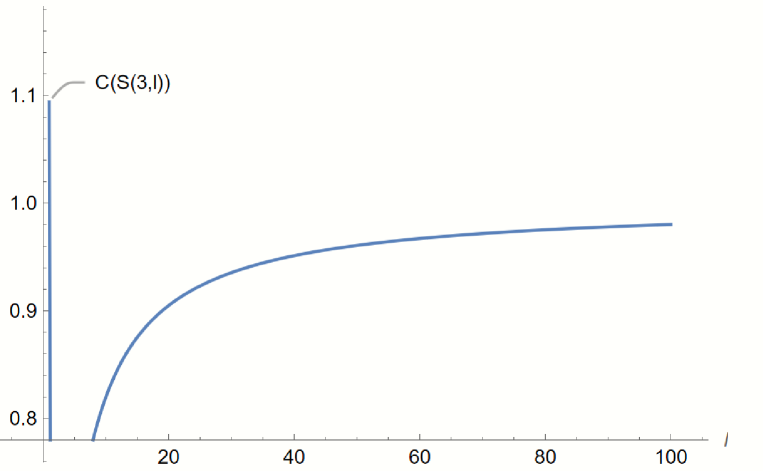
The image displays a single, continuous blue curve plotted on a Cartesian coordinate system. The curve represents a mathematical function labeled "C(S(3,l))". The plot illustrates a relationship where the output value increases as the input variable "l" increases, characterized by a diminishing rate of growth.
### Components/Axes
* **Y-Axis (Vertical):** Represents the output value of the function. The scale is marked with the values 0.8, 0.9, 1.0, and 1.1.
* **X-Axis (Horizontal):** Represents the variable "l" (lowercase L). The scale is marked with the values 20, 40, 60, 80, and 100.
* **Data Series:** A single, solid blue line representing the function C(S(3,l)).
* **Annotation:** A callout label "C(S(3,l))" is positioned in the upper-left area, with a line pointing to the curve.
### Detailed Analysis
The curve exhibits a monotonic increasing trend with a concave-down shape, indicating diminishing marginal returns.
**Approximate Data Points (x, y):**
* **x ≈ 10:** y ≈ 0.80
* **x ≈ 20:** y ≈ 0.90
* **x ≈ 40:** y ≈ 0.94
* **x ≈ 60:** y ≈ 0.96
* **x ≈ 80:** y ≈ 0.97
* **x ≈ 100:** y ≈ 0.98
*Note: The curve starts near the x-axis origin (x ≈ 5) and rises sharply before flattening out as it approaches a horizontal asymptote slightly below 1.0.*
### Key Observations
* **Diminishing Returns:** The slope of the curve is steepest at the lowest values of "l" (between 5 and 20) and becomes progressively flatter as "l" increases toward 100.
* **Asymptotic Behavior:** The curve appears to be approaching a horizontal asymptote, likely at y = 1.0, though it does not reach or cross this value within the visible range of the plot.
* **Function Notation:** The label "C(S(3,l))" implies a nested function where "S" is a function of 3 and "l", and "C" is a function of that result.
### Interpretation
This plot represents a classic "saturation" or "diminishing returns" model.
* **What the data demonstrates:** As the input variable "l" increases, the output of the function C(S(3,l)) increases, but the incremental gain for each additional unit of "l" decreases.
* **Why it matters:** In technical or scientific contexts, this type of curve is common when modeling efficiency, probability, or resource utilization. For example, if "l" represents a resource (like time, length, or energy) and "C" represents a performance metric, the system reaches a point of diminishing returns where adding more resources yields negligible improvements.
* **Reading between the lines:** The fact that the curve approaches 1.0 suggests that 1.0 may represent a theoretical maximum, such as 100% efficiency, full probability, or a normalized capacity limit. The fixed parameter "3" suggests that this is one specific instance of a family of curves; changing the "3" to a different value would likely shift the curve's steepness or the location of the asymptote.