\n
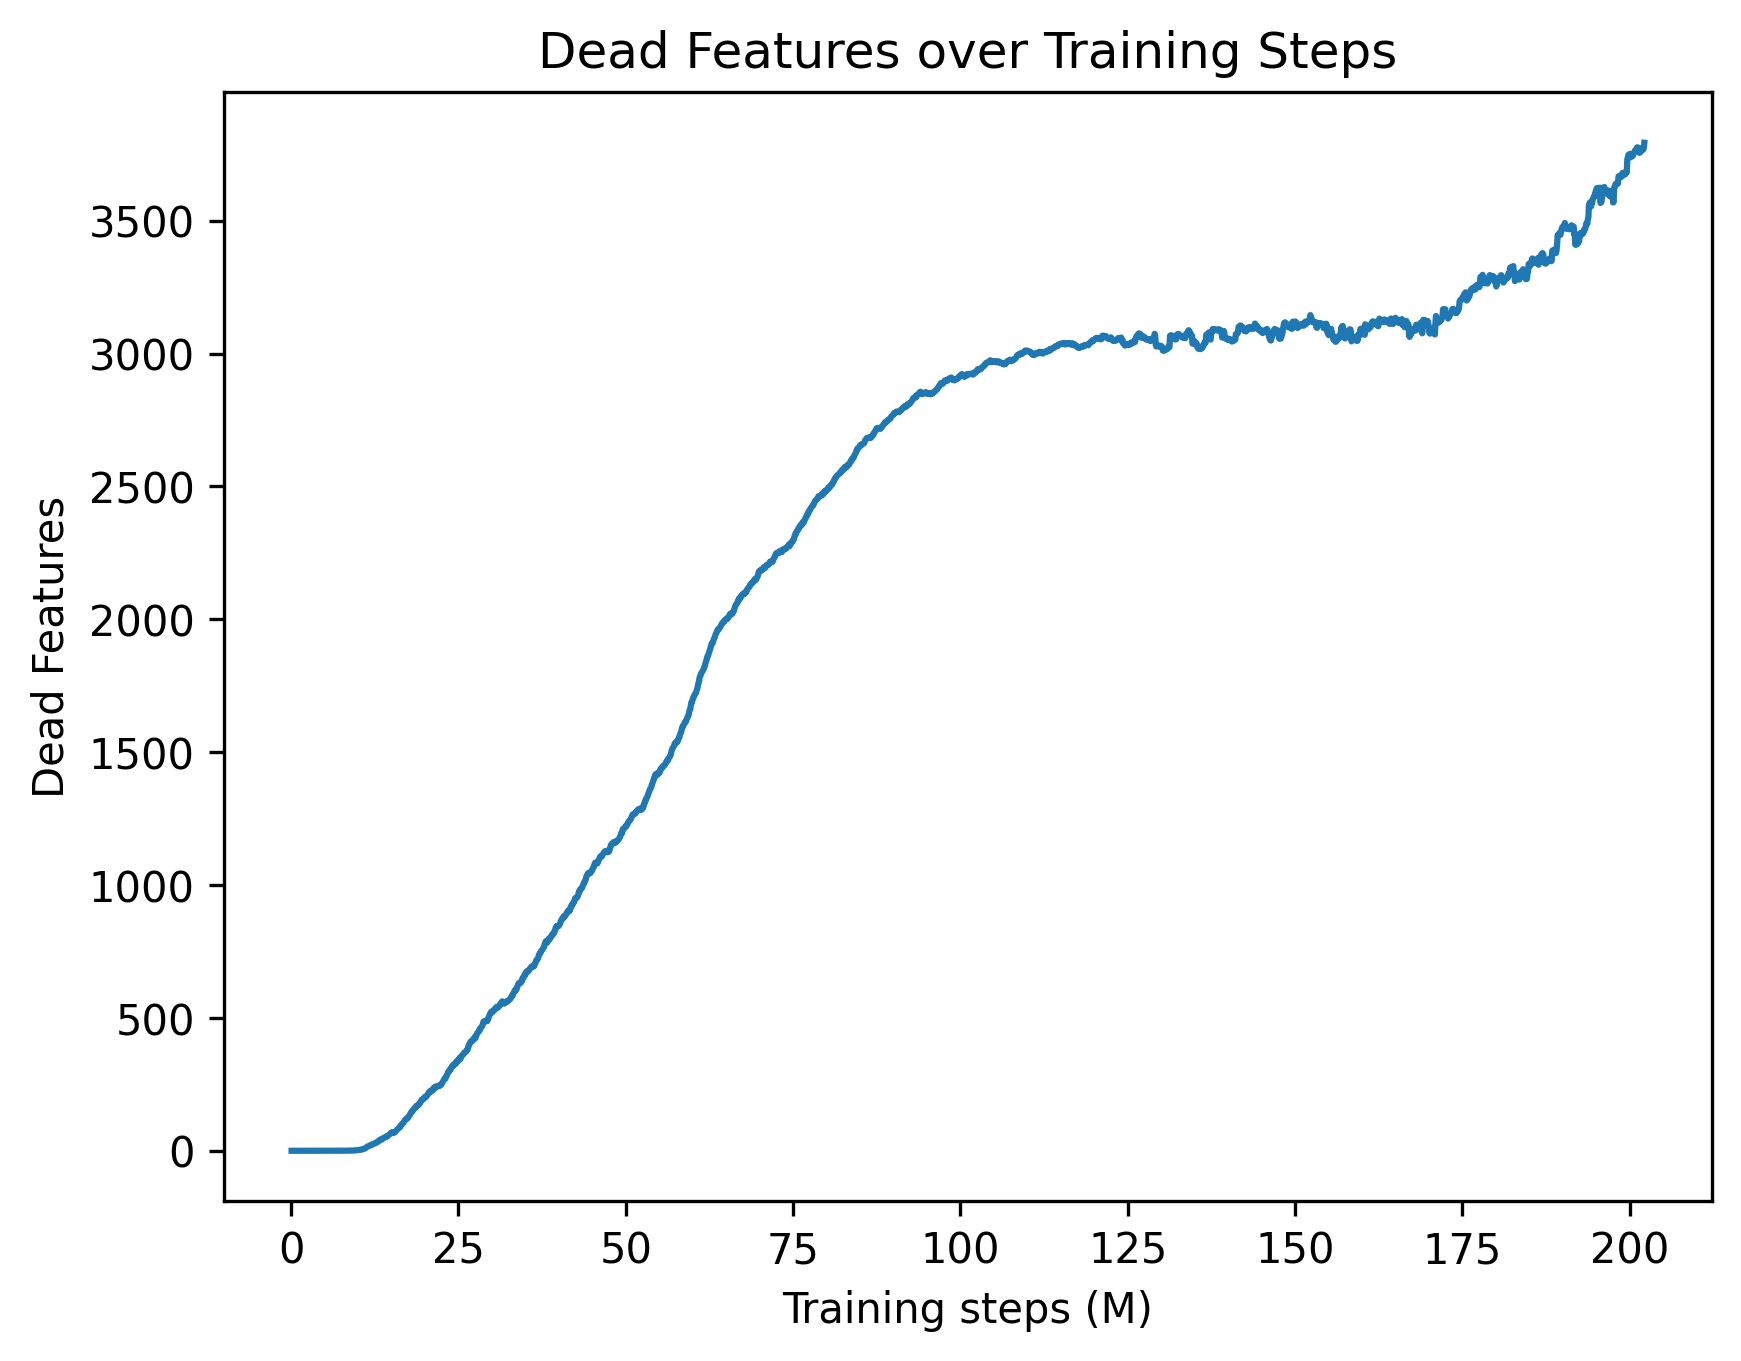
## Line Chart: Dead Features over Training Steps
### Overview
The image presents a line chart illustrating the relationship between the number of "Dead Features" and "Training Steps (M)" during a machine learning training process. The chart shows how the number of dead features changes as the training progresses.
### Components/Axes
* **Title:** "Dead Features over Training Steps" - positioned at the top-center of the chart.
* **X-axis:** "Training steps (M)" - ranging from 0 to 200, with tick marks at intervals of 25.
* **Y-axis:** "Dead Features" - ranging from 0 to 3500, with tick marks at intervals of 500.
* **Data Series:** A single blue line representing the number of dead features over training steps.
### Detailed Analysis
The blue line starts at approximately 0 dead features at 0 training steps. The line exhibits a steep upward slope from 0 to approximately 75 training steps, indicating a rapid increase in dead features. Between 75 and 150 training steps, the slope decreases, showing a slower rate of increase in dead features. From 150 to 200 training steps, the line fluctuates with a slight upward trend, eventually reaching approximately 3500 dead features at 200 training steps.
Here's a breakdown of approximate data points:
* (0, 0)
* (25, 200)
* (50, 1500)
* (75, 2600)
* (100, 3000)
* (125, 3100)
* (150, 3150)
* (175, 3300)
* (200, 3500)
### Key Observations
* The initial phase of training (0-75M steps) experiences the most significant increase in dead features.
* The rate of increase in dead features slows down after 75M steps, suggesting a stabilization or diminishing returns in the training process.
* The line exhibits some fluctuations between 150M and 200M steps, which could indicate oscillations in the training process or noise in the data.
### Interpretation
The chart suggests that as the model is trained, a growing number of features become "dead," meaning they no longer contribute significantly to the model's performance. This is a common phenomenon in machine learning, particularly with complex models and large datasets. The initial rapid increase in dead features could be due to the model quickly identifying and discarding irrelevant or redundant features. The subsequent slowdown in the rate of increase suggests that the model is converging and finding a stable set of features. The fluctuations towards the end of the training process might indicate that the model is still adjusting and refining its feature selection.
The presence of dead features can impact model performance and efficiency. A high number of dead features can increase computational cost and potentially lead to overfitting. Techniques like feature selection or regularization can be employed to mitigate the issue of dead features and improve model performance. The chart provides valuable insight into the training dynamics of the model and can inform decisions about training duration, feature engineering, and model optimization.