## Diagram: Relation Evaluation Steps
### Overview
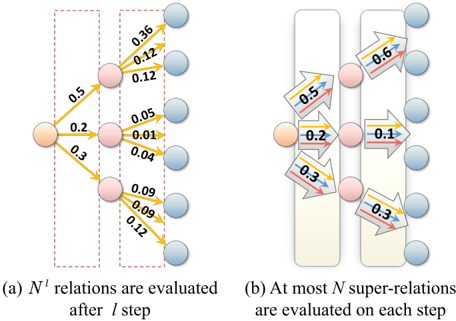
The image presents a comparative diagram illustrating two different approaches to relation evaluation, labeled (a) and (b). Diagram (a) shows a process where *N'* relations are evaluated after each step, while diagram (b) depicts a process evaluating at most *N* super-relations on each step. Both diagrams use node-and-arrow representations to visualize relationships and associated weights.
### Components/Axes
The diagrams consist of nodes (circles) connected by directed arrows. The arrows are labeled with numerical values representing the strength or weight of the relationship. Each diagram is enclosed in a dashed or solid rectangle, indicating the scope of evaluation. Below each diagram is a textual description of the process.
### Detailed Analysis or Content Details
**Diagram (a): N' relations are evaluated after / step**
* **Nodes:** There are 8 nodes arranged in a roughly hierarchical structure. The top node is orange, the second layer has 3 nodes (one orange, two light blue), and the bottom layer has 4 light blue nodes.
* **Arrows & Weights:**
* From the orange top node to the first light blue node: 0.5
* From the orange top node to the second light blue node: 0.2
* From the orange top node to the third light blue node: 0.3
* From the first light blue node to the first bottom node: 0.36
* From the first light blue node to the second bottom node: 0.12
* From the first light blue node to the third bottom node: 0.12
* From the second light blue node to the first bottom node: 0.05
* From the second light blue node to the second bottom node: 0.01
* From the second light blue node to the fourth bottom node: 0.04
* From the third light blue node to the third bottom node: 0.09
* From the third light blue node to the fourth bottom node: 0.09
* From the third light blue node to the first bottom node: 0.12
**Diagram (b): At most N super-relations are evaluated on each step**
* **Nodes:** There are 8 nodes arranged in two vertical columns of 4 nodes each. The top node in the left column is orange, the remaining nodes are light blue.
* **Arrows & Weights:**
* From the orange top node to the first light blue node: 0.5
* From the orange top node to the second light blue node: 0.2
* From the first light blue node to the first light blue node in the right column: 0.1
* From the second light blue node to the second light blue node in the right column: 0.3
* From the second light blue node to the third light blue node in the right column: 0.3
* From the third light blue node to the fourth light blue node in the right column: 0.6
### Key Observations
* Diagram (a) shows a branching structure where a single source node connects to multiple destination nodes, which then connect to further nodes. The weights are relatively small, and distributed across multiple paths.
* Diagram (b) shows a more streamlined structure with fewer connections. The weights are generally higher than in diagram (a).
* The text below each diagram indicates a difference in the number of relations evaluated per step. Diagram (a) evaluates *N'* relations, while diagram (b) evaluates at most *N* super-relations.
### Interpretation
The diagrams illustrate two different strategies for evaluating relationships within a network. Diagram (a) represents a more exhaustive, potentially slower approach, evaluating a larger number of individual relations (*N'*) at each step. This could be useful for identifying subtle or weak connections. Diagram (b) represents a more focused, potentially faster approach, evaluating a smaller number of stronger, "super-relations" (*N*) at each step. This could be useful for quickly identifying the most important connections.
The use of weights on the arrows suggests that the relationships are not all equal in strength. The differences in the network structure and the number of relations evaluated per step likely reflect trade-offs between accuracy, speed, and computational cost. The diagrams are likely used to compare the efficiency of different algorithms or methods for relation extraction or knowledge graph construction. The use of orange nodes may indicate a starting point or a key entity in the network.