\n
## Line Chart: Training and Testing Accuracy vs. Epoch for Different 'd' Values
### Overview
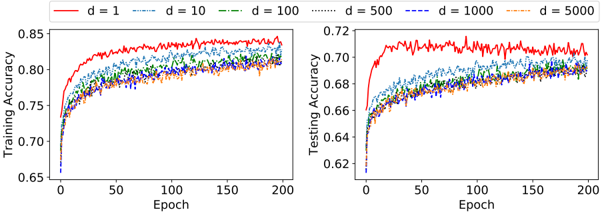
The image presents two line charts side-by-side. The left chart displays Training Accuracy against Epoch, while the right chart shows Testing Accuracy against Epoch. Both charts compare the performance of models with different values of 'd' (1, 10, 100, 500, 1000, and 5000) during the training process.
### Components/Axes
* **X-axis (Both Charts):** Epoch, ranging from 0 to 200.
* **Y-axis (Left Chart):** Training Accuracy, ranging from 0.65 to 0.85.
* **Y-axis (Right Chart):** Testing Accuracy, ranging from 0.62 to 0.72.
* **Legend (Top-Center):** Indicates the different values of 'd' and their corresponding line styles and colors:
* d = 1 (Solid Red Line)
* d = 10 (Dashed Blue Line)
* d = 100 (Dashed Green Line)
* d = 500 (Dashed Cyan Line)
* d = 1000 (Dashed Magenta Line)
* d = 5000 (Dashed Yellow Line)
### Detailed Analysis or Content Details
**Left Chart (Training Accuracy):**
* **d = 1 (Red):** The line starts at approximately 0.72 at Epoch 0 and steadily increases, reaching a plateau around 0.83-0.85 between Epochs 100 and 200. There are minor fluctuations.
* **d = 10 (Blue):** Starts at approximately 0.71 at Epoch 0. The line increases more slowly than the red line, reaching around 0.79-0.81 by Epoch 200.
* **d = 100 (Green):** Starts at approximately 0.70 at Epoch 0. The line increases at a moderate pace, reaching around 0.80-0.82 by Epoch 200.
* **d = 500 (Cyan):** Starts at approximately 0.70 at Epoch 0. The line increases at a similar pace to the green line, reaching around 0.81-0.82 by Epoch 200.
* **d = 1000 (Magenta):** Starts at approximately 0.69 at Epoch 0. The line increases at a slower pace, reaching around 0.79-0.80 by Epoch 200.
* **d = 5000 (Yellow):** Starts at approximately 0.69 at Epoch 0. The line increases at a similar pace to the magenta line, reaching around 0.79-0.80 by Epoch 200.
**Right Chart (Testing Accuracy):**
* **d = 1 (Red):** The line starts at approximately 0.64 at Epoch 0 and increases to around 0.71-0.72 by Epoch 200, with some fluctuations.
* **d = 10 (Blue):** Starts at approximately 0.63 at Epoch 0. The line increases more slowly than the red line, reaching around 0.68-0.69 by Epoch 200.
* **d = 100 (Green):** Starts at approximately 0.63 at Epoch 0. The line increases at a moderate pace, reaching around 0.69-0.70 by Epoch 200.
* **d = 500 (Cyan):** Starts at approximately 0.63 at Epoch 0. The line increases at a similar pace to the green line, reaching around 0.69-0.70 by Epoch 200.
* **d = 1000 (Magenta):** Starts at approximately 0.62 at Epoch 0. The line increases at a slower pace, reaching around 0.68-0.69 by Epoch 200.
* **d = 5000 (Yellow):** Starts at approximately 0.62 at Epoch 0. The line increases at a similar pace to the magenta line, reaching around 0.68-0.69 by Epoch 200.
### Key Observations
* The model with d = 1 consistently achieves the highest training and testing accuracy across all epochs.
* As 'd' increases, the training and testing accuracy generally decrease.
* The gap between training and testing accuracy is relatively small for all values of 'd', suggesting limited overfitting.
* The lines for d = 100, 500, 1000, and 5000 are relatively close to each other in both charts, indicating similar performance for these values of 'd'.
### Interpretation
The data suggests that the parameter 'd' significantly impacts the performance of the model. A smaller value of 'd' (specifically, d = 1) leads to the best training and testing accuracy. Increasing 'd' appears to reduce the model's ability to learn effectively, potentially due to increased complexity or a higher risk of getting stuck in local optima during optimization.
The close proximity of the lines for d = 100, 500, 1000, and 5000 suggests that there might be a diminishing return in performance as 'd' increases beyond a certain point. The relatively small gap between training and testing accuracy indicates that the model is generalizing well to unseen data, even with larger values of 'd'.
The charts provide a clear visualization of the trade-off between model complexity (represented by 'd') and performance. The optimal value of 'd' appears to be 1, based on the observed accuracy levels. Further investigation might be needed to understand the underlying reasons for this relationship and to explore other parameter settings that could potentially improve performance.