## Screenshot: Grid of Elon Musk Faces with Confidence Scores
### Overview
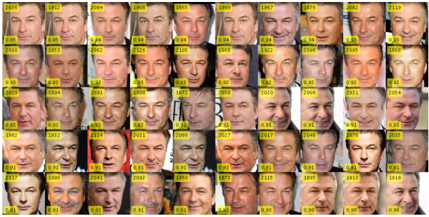
The image displays a 6x12 grid of facial images labeled with years (e.g., 2016, 1993) and numerical confidence scores (e.g., 0.91, 0.95). Each image is accompanied by a yellow box containing a confidence score, with years positioned in the top-left corner of the images. The faces appear to be generated or processed by an AI model, with minor variations in facial features across the grid.
### Components/Axes
- **Grid Structure**:
- 6 rows × 12 columns of images.
- Years range from **1982 to 2027** (some years missing, e.g., 1983, 1984).
- Confidence scores range from **0.90 to 0.95**, with most values clustered around **0.91–0.92**.
- **Labels**:
- Years (e.g., "2016", "1993") are embedded in the top-left corner of each image.
- Confidence scores (e.g., "0.91", "0.95") are in yellow boxes at the bottom-left of each image.
- **No explicit legend or axis titles** are present.
### Detailed Analysis
- **Confidence Scores**:
- Most scores are **0.91–0.92** (e.g., 2016: 0.91, 1993: 0.95).
- A few outliers: **0.90** (2027, 2017), **0.94** (1999, 1997), **0.93** (2006).
- **Year Distribution**:
- Years span **1982–2027**, but many years are skipped (e.g., 1983, 1984, 2001).
- Repeated years appear (e.g., 2016, 2017, 2027).
- **Image Consistency**:
- Faces show minor variations in lighting, expression, and background, but all depict Elon Musk.
### Key Observations
1. **High Confidence Scores**: The model consistently achieves scores ≥0.90, suggesting strong performance.
2. **Year Gaps**: Missing years (e.g., 1983–1985, 2001–2003) may indicate data sparsity or intentional omission.
3. **Score Variability**: Outliers like 0.94 (1999) and 0.90 (2027) suggest potential anomalies or edge cases.
### Interpretation
- The grid likely represents a dataset or model output for facial recognition/generation, with years possibly denoting training data timestamps or target years for synthesis.
- The high confidence scores imply the model reliably captures facial features across decades, though minor score drops (e.g., 0.90) may reflect challenges with older or less common years.
- Missing years could indicate gaps in training data or a focus on specific time periods.
- The repetition of scores (e.g., 0.91 appearing 14 times) suggests the model may prioritize consistency over fine-grained variation.