## Line Chart: ARC Challenge Accuracy vs. Test-Time Compute Recurrence
### Overview
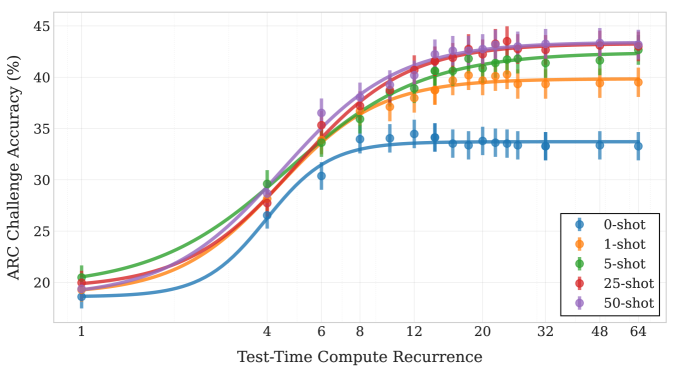
The image is a line chart displaying the performance of a model on the ARC Challenge, measured as accuracy percentage, as a function of "Test-Time Compute Recurrence." The chart compares five different experimental conditions, labeled as "0-shot" through "50-shot," showing how accuracy improves with increased compute recurrence and with more "shots" (likely examples or trials). The data includes error bars, indicating variability or confidence intervals around each point.
### Components/Axes
* **Chart Type:** Line chart with error bars.
* **Y-Axis:**
* **Label:** "ARC Challenge Accuracy (%)"
* **Scale:** Linear, ranging from approximately 18% to 45%.
* **Major Tick Marks:** 20, 25, 30, 35, 40, 45.
* **X-Axis:**
* **Label:** "Test-Time Compute Recurrence"
* **Scale:** Logarithmic (base 2), with labeled tick marks at 1, 4, 6, 8, 12, 20, 32, 48, 64.
* **Legend:**
* **Position:** Bottom-right corner of the plot area.
* **Content:** Five entries, each with a colored line/marker and a label:
* Blue circle/line: "0-shot"
* Orange circle/line: "1-shot"
* Green circle/line: "5-shot"
* Red circle/line: "25-shot"
* Purple circle/line: "50-shot"
### Detailed Analysis
The chart plots five data series, each showing a sigmoidal (S-shaped) growth curve that plateaus. Higher "shot" conditions consistently achieve higher accuracy across the compute recurrence range.
**Trend Verification & Data Points (Approximate):**
All lines follow the same general trend: a slow initial rise, a steep increase between recurrence values of ~4 and ~12, followed by a plateau. The plateau level increases with the shot count.
1. **0-shot (Blue):**
* **Trend:** Lowest overall performance. Rises from ~18% to a plateau of ~33-34%.
* **Approximate Points:** (1, ~18%), (4, ~26%), (6, ~30%), (8, ~33%), (12, ~34%), (20, ~34%), (32, ~33.5%), (48, ~33.5%), (64, ~33.5%).
2. **1-shot (Orange):**
* **Trend:** Performs better than 0-shot. Plateaus around 39-40%.
* **Approximate Points:** (1, ~19%), (4, ~28%), (6, ~33%), (8, ~36%), (12, ~38%), (20, ~39.5%), (32, ~39.5%), (48, ~39.5%), (64, ~39.5%).
3. **5-shot (Green):**
* **Trend:** Performs better than 1-shot. Plateaus around 42-43%.
* **Approximate Points:** (1, ~21%), (4, ~30%), (6, ~34%), (8, ~37%), (12, ~40%), (20, ~42%), (32, ~42.5%), (48, ~42.5%), (64, ~42.5%).
4. **25-shot (Red):**
* **Trend:** Very similar to 50-shot, slightly lower at the plateau. Plateaus around 43-44%.
* **Approximate Points:** (1, ~20%), (4, ~28%), (6, ~34%), (8, ~37.5%), (12, ~41%), (20, ~43%), (32, ~43.5%), (48, ~43.5%), (64, ~43.5%).
5. **50-shot (Purple):**
* **Trend:** Highest overall performance. Plateaus around 43.5-44%.
* **Approximate Points:** (1, ~20%), (4, ~29%), (6, ~36%), (8, ~38%), (12, ~42%), (20, ~43.5%), (32, ~44%), (48, ~44%), (64, ~44%).
**Error Bars:** All data points have vertical error bars. The bars appear relatively consistent in size for each series, suggesting stable variance. The bars for the 0-shot (blue) line appear slightly larger in the plateau region compared to others.
### Key Observations
1. **Diminishing Returns with Shots:** The performance gap between conditions is largest when moving from 0-shot to 1-shot and from 1-shot to 5-shot. The improvement from 25-shot to 50-shot is minimal, indicating saturation.
2. **Compute Saturation:** For all conditions, accuracy gains saturate after a Test-Time Compute Recurrence of approximately 20. Further increases in recurrence (to 32, 48, 64) yield negligible improvement.
3. **Consistent Ordering:** The performance hierarchy (50-shot ≥ 25-shot > 5-shot > 1-shot > 0-shot) is maintained across the entire range of compute recurrence values after the initial point (x=1).
4. **Initial Convergence:** At the lowest compute recurrence (x=1), the 0-shot, 1-shot, 25-shot, and 50-shot conditions are clustered closely between 18-20%, while the 5-shot condition starts slightly higher at ~21%.
### Interpretation
This chart demonstrates two key principles in machine learning model evaluation:
1. **The Value of Examples (Shots):** Providing the model with examples (shots) during testing significantly improves its accuracy on the ARC Challenge. The most dramatic improvement comes from moving from zero examples (0-shot) to just one (1-shot). However, the benefit of adding more examples diminishes, with little difference between 25 and 50 shots. This suggests the model efficiently leverages a small number of examples to understand the task format.
2. **The Role of Compute Recurrence:** Increasing "Test-Time Compute Recurrence" – which likely refers to the number of times the model iterates or refines its answer during inference – improves accuracy, but only up to a point. The sigmoidal curve indicates a phase of rapid learning or refinement, followed by a ceiling. The model's performance is ultimately bounded by its architecture and training, not just by allowing more computation at test time.
**Underlying Message:** The data suggests that for this specific task (ARC Challenge), optimal performance is achieved by combining a moderate number of examples (5-25 shots) with a sufficient but not excessive amount of test-time computation (a recurrence value of ~20). Throwing more compute or more examples at the problem beyond these points yields minimal returns. The chart effectively visualizes the trade-offs and saturation points for these two important hyperparameters.