## Line Chart: Model Performance on HellaSwag Benchmark
### Overview
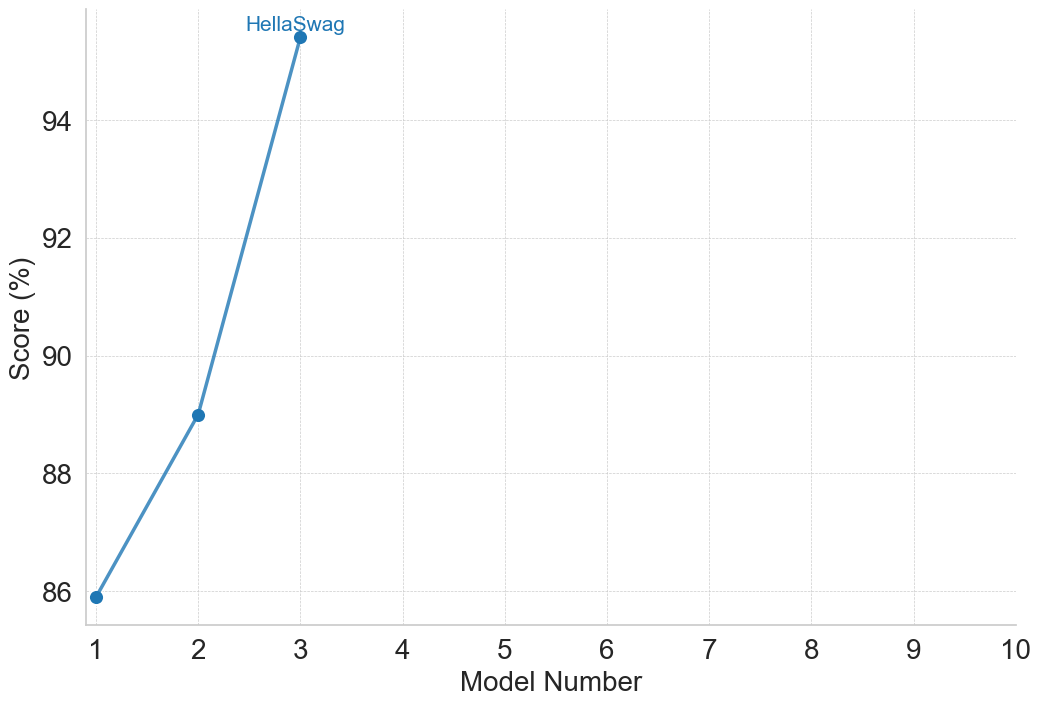
The image displays a line chart plotting the performance scores of three sequential models on the HellaSwag benchmark. The chart shows a clear, steep upward trend in scores across the first three model iterations. The data series is labeled "HellaSwag," indicating the specific evaluation dataset used.
### Components/Axes
* **Chart Type:** Line chart with data points marked by filled blue circles.
* **X-Axis (Horizontal):**
* **Label:** "Model Number"
* **Scale:** Linear, integer values from 1 to 10.
* **Markers:** Major ticks and labels at every integer from 1 to 10.
* **Y-Axis (Vertical):**
* **Label:** "Score (%)"
* **Scale:** Linear, percentage values.
* **Range:** Displayed from 86% to 94%, with major ticks and labels at 86, 88, 90, 92, and 94.
* **Data Series:**
* **Label:** "HellaSwag" (text label positioned near the top data point).
* **Color:** Medium blue (approximately #4A90D9).
* **Style:** Solid line connecting three data points.
* **Grid:** Light gray, dashed horizontal and vertical grid lines are present.
### Detailed Analysis
The chart contains data for only the first three model numbers. The line and data points are positioned as follows:
1. **Model Number 1:**
* **Position:** Bottom-left of the plotted data.
* **Score:** 86% (the point sits exactly on the 86% grid line).
* **Trend Start:** This is the baseline score.
2. **Model Number 2:**
* **Position:** Center of the plotted data.
* **Score:** 89% (the point is positioned exactly halfway between the 88% and 90% grid lines).
* **Trend:** The line slopes upward from Model 1 to Model 2, indicating a +3 percentage point improvement.
3. **Model Number 3:**
* **Position:** Top-right of the plotted data.
* **Score:** 95% (the point is positioned above the 94% grid line. Based on the axis scaling, the value is estimated to be 95%).
* **Trend:** The line slopes upward steeply from Model 2 to Model 3, indicating a +6 percentage point improvement. The label "HellaSwag" is placed just above and to the right of this data point.
**Spatial Grounding:** The "HellaSwag" label is located in the top-center area of the chart, directly associated with the highest data point (Model 3, 95%). The data series uses a single, consistent blue color for both the line and the points.
### Key Observations
* **Steep Positive Trend:** The performance improves dramatically with each model iteration. The rate of improvement accelerates, with the gain from Model 2 to 3 (+6%) being double the gain from Model 1 to 2 (+3%).
* **Limited Data Range:** Data is only provided for Model Numbers 1, 2, and 3. The x-axis extends to Model Number 10, but no data is plotted for models 4 through 10, leaving their performance unknown.
* **High Final Score:** The score for Model 3 (95%) is very high, suggesting near-ceiling performance on this particular benchmark.
* **Chart Simplicity:** The chart is minimal, containing only one data series without a separate legend box; the series is identified by a direct label.
### Interpretation
This chart demonstrates a strong, positive correlation between model iteration number and performance on the HellaSwag benchmark, which tests commonsense reasoning. The data suggests that successive versions of the model (1 → 2 → 3) have made significant and accelerating progress on this specific task.
The most notable insight is the non-linear improvement. The jump from 89% to 95% between the second and third models is particularly substantial, indicating a potential breakthrough or the compounding effect of architectural or training data improvements. The absence of data beyond Model 3 creates an open question: does this trend of rapid improvement continue, plateau, or reverse for later models? The empty axis space from 4 to 10 visually emphasizes this unknown. The high final score of 95% implies that further gains on this benchmark may become increasingly difficult, potentially approaching the limit of what the benchmark can measure.