\n
## Line Chart: Accuracy vs. Number of Operations
### Overview
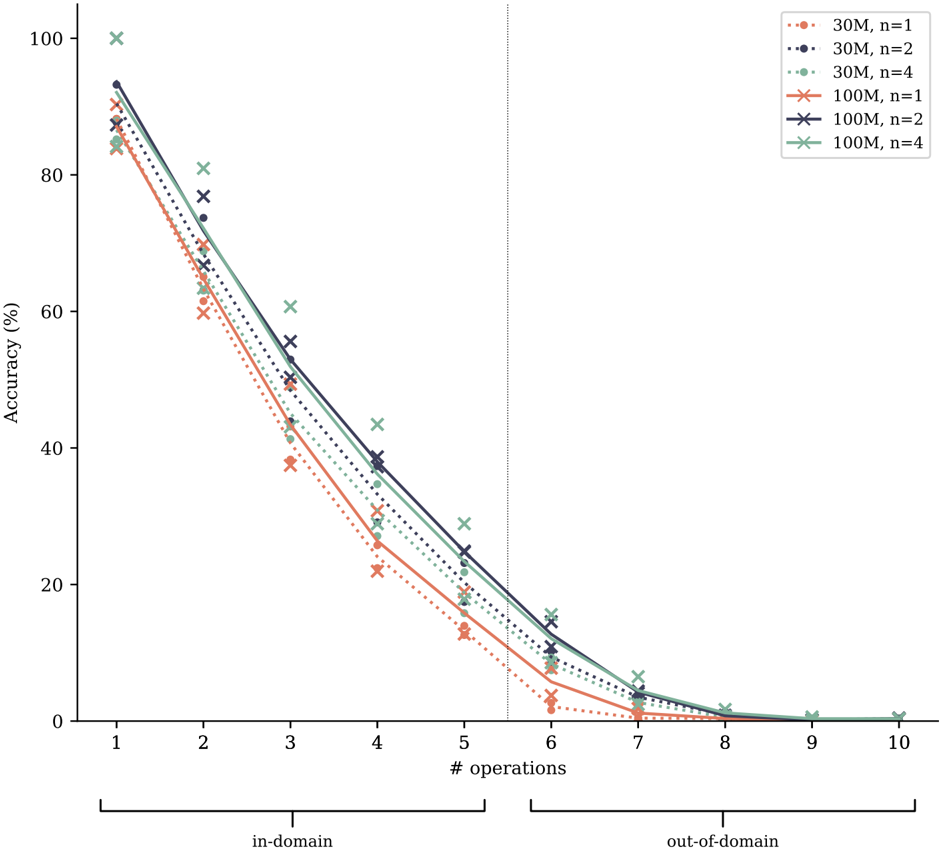
This line chart depicts the relationship between the number of operations performed and the resulting accuracy, for different model sizes and values of 'n'. The chart is divided into two regions: "in-domain" (operations 1-5) and "out-of-domain" (operations 6-10), demarcated by a vertical dashed line. Six distinct lines represent different combinations of model size (30M or 100M parameters) and 'n' values (1, 2, or 4).
### Components/Axes
* **X-axis:** "# operations" - Ranging from 1 to 10, with tick marks at integer values.
* **Y-axis:** "Accuracy (%)" - Ranging from 0 to 100, with tick marks at 20-unit intervals.
* **Legend:** Located in the top-right corner, listing the following data series:
* 30M, n=1 (represented by a dotted orange line)
* 30M, n=2 (represented by a dotted purple line)
* 30M, n=4 (represented by a dotted teal line)
* 100M, n=1 (represented by a solid orange line)
* 100M, n=2 (represented by a solid purple line)
* 100M, n=4 (represented by a solid teal line)
* **Domain Labels:** "in-domain" (left side, operations 1-5) and "out-of-domain" (right side, operations 6-10) are labeled below the x-axis.
### Detailed Analysis
Here's a breakdown of each line's trend and approximate data points. Note that values are estimated from the visual representation.
* **30M, n=1 (dotted orange):** The line slopes downward, starting at approximately 92% accuracy at 1 operation. It decreases steadily to around 10% accuracy at 9 operations. Approximate points: (1, 92%), (2, 80%), (3, 65%), (4, 50%), (5, 35%), (6, 20%), (7, 10%), (8, 5%), (9, 2%).
* **30M, n=2 (dotted purple):** This line also slopes downward, but starts at a higher accuracy of approximately 98% at 1 operation. It decreases to around 15% accuracy at 9 operations. Approximate points: (1, 98%), (2, 88%), (3, 75%), (4, 60%), (5, 45%), (6, 25%), (7, 15%), (8, 8%), (9, 3%).
* **30M, n=4 (dotted teal):** Starts at approximately 95% accuracy at 1 operation and declines to around 5% accuracy at 9 operations. Approximate points: (1, 95%), (2, 85%), (3, 70%), (4, 55%), (5, 40%), (6, 20%), (7, 8%), (8, 3%), (9, 1%).
* **100M, n=1 (solid orange):** Starts at approximately 95% accuracy at 1 operation and declines to around 10% accuracy at 9 operations. Approximate points: (1, 95%), (2, 85%), (3, 72%), (4, 60%), (5, 48%), (6, 25%), (7, 12%), (8, 6%), (9, 2%).
* **100M, n=2 (solid purple):** Starts at approximately 99% accuracy at 1 operation and declines to around 15% accuracy at 9 operations. Approximate points: (1, 99%), (2, 92%), (3, 80%), (4, 68%), (5, 55%), (6, 30%), (7, 18%), (8, 9%), (9, 4%).
* **100M, n=4 (solid teal):** Starts at approximately 98% accuracy at 1 operation and declines to around 5% accuracy at 9 operations. Approximate points: (1, 98%), (2, 90%), (3, 78%), (4, 65%), (5, 50%), (6, 28%), (7, 10%), (8, 4%), (9, 1%).
### Key Observations
* Accuracy generally decreases as the number of operations increases for all model sizes and 'n' values.
* Larger models (100M) consistently exhibit higher accuracy than smaller models (30M) for the same 'n' value, particularly in the in-domain region.
* Increasing 'n' generally improves accuracy, especially in the in-domain region.
* The rate of accuracy decline is steeper in the in-domain region (operations 1-5) compared to the out-of-domain region (operations 6-10).
* The lines representing 100M models with n=1, n=2, and n=4 are very close together in the in-domain region, suggesting diminishing returns for increasing 'n' beyond a certain point.
### Interpretation
This chart demonstrates the trade-off between model complexity (size and 'n' value) and accuracy as the number of operations increases. The division into "in-domain" and "out-of-domain" suggests a shift in the data distribution or the nature of the operations being performed. The steeper decline in accuracy in the in-domain region indicates that the model performs well within its training distribution, but its performance degrades more rapidly when faced with operations outside of that distribution.
The larger models (100M) are more robust to increasing operations, maintaining higher accuracy levels. However, even the largest models eventually experience a significant drop in accuracy as the number of operations increases, highlighting the limitations of the models and the potential for catastrophic forgetting or generalization issues. The 'n' parameter appears to influence the initial accuracy and the rate of decline, but its effect diminishes with larger models. The chart suggests that while increasing model size and 'n' can improve performance, it's crucial to consider the domain of operations and the potential for performance degradation when operating outside of the training distribution.