## Heatmap: Recompute Cost vs. Batch Size and Window Size
### Overview
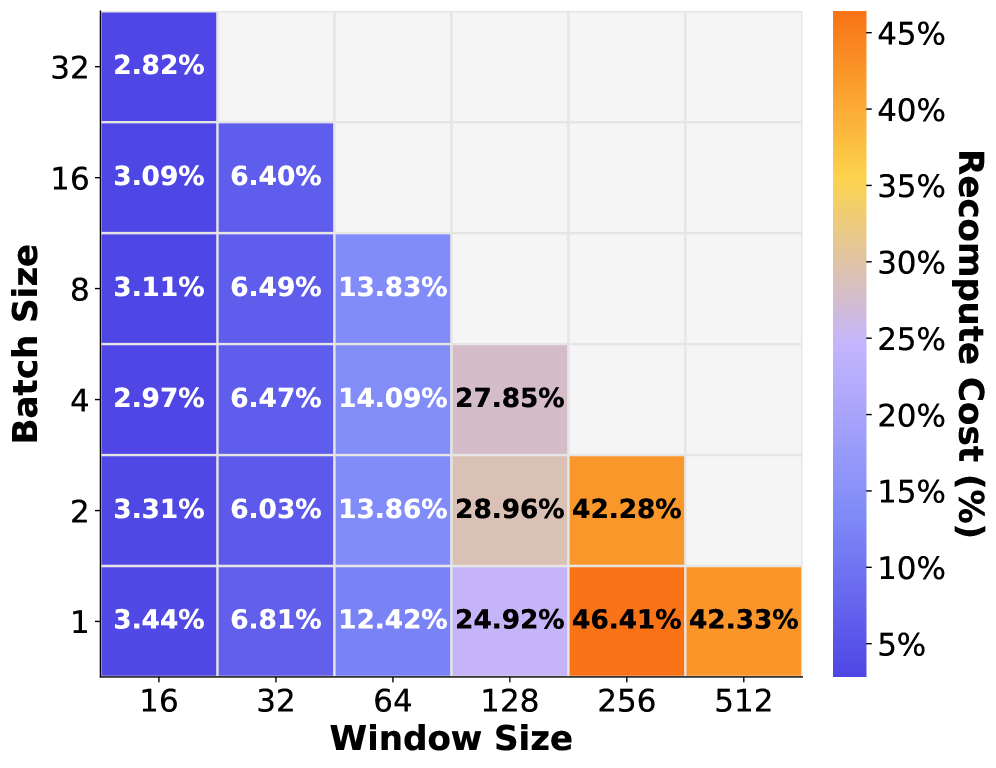
The image is a heatmap visualizing the recompute cost (in percentage) for different combinations of batch sizes and window sizes. The heatmap uses a color gradient from blue to orange, where blue represents lower recompute costs and orange represents higher costs. The x-axis represents window size, and the y-axis represents batch size.
### Components/Axes
* **X-axis:** Window Size, with values 16, 32, 64, 128, 256, and 512.
* **Y-axis:** Batch Size, with values 1, 2, 4, 8, 16, and 32.
* **Color Legend (Right):** Recompute Cost (%), ranging from 5% (blue) to 45% (orange). The legend has markers at 5%, 10%, 15%, 20%, 25%, 30%, 35%, 40%, and 45%.
### Detailed Analysis
The heatmap presents recompute cost percentages for various batch size and window size combinations. The values are displayed within each cell of the heatmap.
Here's a breakdown of the values:
* **Batch Size 32:**
* Window Size 16: 2.82% (Blue)
* **Batch Size 16:**
* Window Size 16: 3.09% (Blue)
* Window Size 32: 6.40% (Blue)
* **Batch Size 8:**
* Window Size 16: 3.11% (Blue)
* Window Size 32: 6.49% (Blue)
* Window Size 64: 13.83% (Blue)
* **Batch Size 4:**
* Window Size 16: 2.97% (Blue)
* Window Size 32: 6.47% (Blue)
* Window Size 64: 14.09% (Blue)
* Window Size 128: 27.85% (Tan)
* **Batch Size 2:**
* Window Size 16: 3.31% (Blue)
* Window Size 32: 6.03% (Blue)
* Window Size 64: 13.86% (Blue)
* Window Size 128: 28.96% (Tan)
* Window Size 256: 42.28% (Orange)
* **Batch Size 1:**
* Window Size 16: 3.44% (Blue)
* Window Size 32: 6.81% (Blue)
* Window Size 64: 12.42% (Blue)
* Window Size 128: 24.92% (Blue-Tan)
* Window Size 256: 46.41% (Orange)
* Window Size 512: 42.33% (Orange)
### Key Observations
* The recompute cost generally increases as both the batch size decreases and the window size increases.
* Lower batch sizes (1, 2, 4) show a more significant increase in recompute cost as the window size increases compared to higher batch sizes (8, 16, 32).
* The lowest recompute costs are observed with larger batch sizes (16, 32) and smaller window sizes (16, 32).
* The highest recompute costs are observed with the smallest batch size (1) and larger window sizes (256, 512).
### Interpretation
The heatmap illustrates the trade-offs between batch size, window size, and recompute cost. Smaller batch sizes often lead to increased recomputation, especially when combined with larger window sizes. This suggests that the computational overhead of recomputing activations becomes more significant when processing smaller chunks of data over larger contexts. Conversely, larger batch sizes reduce the need for frequent recomputation, resulting in lower costs, particularly with smaller window sizes. The data suggests that optimizing both batch size and window size is crucial for minimizing recompute costs in a given system or model.