## Line Graphs: Llama-3-8B and Llama-3-70B Answer Accuracy vs. Layer
### Overview
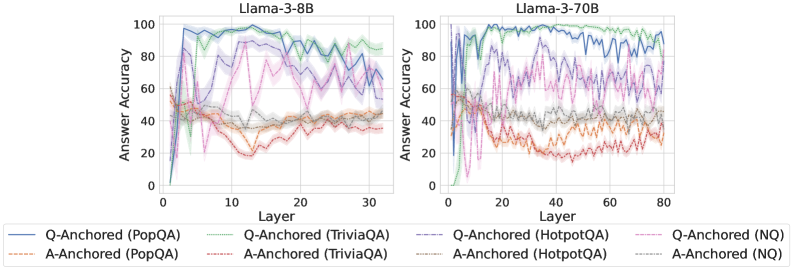
The image presents two line graphs comparing the answer accuracy of Llama-3-8B and Llama-3-70B models across different layers for various question-answering datasets. The x-axis represents the layer number, and the y-axis represents the answer accuracy. Each graph displays six data series, representing Q-Anchored and A-Anchored performance on PopQA, TriviaQA, HotpotQA, and NQ datasets.
### Components/Axes
* **Titles:**
* Left Graph: "Llama-3-8B"
* Right Graph: "Llama-3-70B"
* **X-axis:**
* Label: "Layer"
* Left Graph: Scale from 0 to 30, with tick marks at intervals of 10.
* Right Graph: Scale from 0 to 80, with tick marks at intervals of 20.
* **Y-axis:**
* Label: "Answer Accuracy"
* Scale: 0 to 100, with tick marks at intervals of 20.
* **Legend:** Located at the bottom of the image.
* **Q-Anchored (PopQA):** Solid Blue Line
* **A-Anchored (PopQA):** Dashed Brown Line
* **Q-Anchored (TriviaQA):** Dotted Green Line
* **A-Anchored (TriviaQA):** Dashed Orange Line
* **Q-Anchored (HotpotQA):** Dash-Dot Purple Line
* **A-Anchored (HotpotQA):** Dotted Red Line
* **Q-Anchored (NQ):** Dash-Dot-Dot Light Purple Line
* **A-Anchored (NQ):** Dotted Gray Line
### Detailed Analysis
**Left Graph: Llama-3-8B**
* **Q-Anchored (PopQA):** (Solid Blue Line) Starts at approximately 0% accuracy, rapidly increases to around 90-100% by layer 10, and then fluctuates between 80% and 100% for the remaining layers.
* **A-Anchored (PopQA):** (Dashed Brown Line) Starts around 50% accuracy, decreases to around 40% by layer 5, and then remains relatively stable between 40% and 50% for the rest of the layers.
* **Q-Anchored (TriviaQA):** (Dotted Green Line) Starts around 50% accuracy, increases to around 90% by layer 10, and then fluctuates between 80% and 100% for the remaining layers.
* **A-Anchored (TriviaQA):** (Dashed Orange Line) Starts around 50% accuracy, decreases to around 30% by layer 10, and then remains relatively stable between 20% and 40% for the rest of the layers.
* **Q-Anchored (HotpotQA):** (Dash-Dot Purple Line) Starts around 60% accuracy, increases to around 80% by layer 10, and then fluctuates between 60% and 90% for the remaining layers.
* **A-Anchored (HotpotQA):** (Dotted Red Line) Starts around 50% accuracy, decreases to around 30% by layer 10, and then remains relatively stable between 20% and 40% for the rest of the layers.
* **Q-Anchored (NQ):** (Dash-Dot-Dot Light Purple Line) Starts around 60% accuracy, increases to around 80% by layer 10, and then fluctuates between 60% and 90% for the remaining layers.
* **A-Anchored (NQ):** (Dotted Gray Line) Starts around 50% accuracy, decreases to around 40% by layer 5, and then remains relatively stable between 40% and 50% for the rest of the layers.
**Right Graph: Llama-3-70B**
* **Q-Anchored (PopQA):** (Solid Blue Line) Starts at approximately 60% accuracy, rapidly increases to around 90-100% by layer 10, and then fluctuates between 80% and 100% for the remaining layers.
* **A-Anchored (PopQA):** (Dashed Brown Line) Starts around 50% accuracy, decreases to around 40% by layer 20, and then remains relatively stable between 40% and 50% for the rest of the layers.
* **Q-Anchored (TriviaQA):** (Dotted Green Line) Starts around 60% accuracy, increases to around 90% by layer 10, and then fluctuates between 80% and 100% for the remaining layers.
* **A-Anchored (TriviaQA):** (Dashed Orange Line) Starts around 40% accuracy, decreases to around 20% by layer 40, and then remains relatively stable between 20% and 30% for the rest of the layers.
* **Q-Anchored (HotpotQA):** (Dash-Dot Purple Line) Starts around 60% accuracy, increases to around 80% by layer 10, and then fluctuates between 60% and 90% for the remaining layers.
* **A-Anchored (HotpotQA):** (Dotted Red Line) Starts around 40% accuracy, decreases to around 20% by layer 40, and then remains relatively stable between 20% and 30% for the rest of the layers.
* **Q-Anchored (NQ):** (Dash-Dot-Dot Light Purple Line) Starts around 60% accuracy, increases to around 80% by layer 10, and then fluctuates between 60% and 90% for the remaining layers.
* **A-Anchored (NQ):** (Dotted Gray Line) Starts around 50% accuracy, decreases to around 40% by layer 20, and then remains relatively stable between 40% and 50% for the rest of the layers.
### Key Observations
* For both models, Q-Anchored performance on PopQA and TriviaQA datasets shows a rapid increase in accuracy within the first 10 layers, reaching near-perfect performance.
* A-Anchored performance on all datasets is significantly lower than Q-Anchored performance, with accuracy generally remaining below 50%.
* The Llama-3-70B model has a longer x-axis (more layers) than the Llama-3-8B model, but the trends are similar.
* The shaded regions around each line indicate the variance or uncertainty in the data.
### Interpretation
The data suggests that Q-Anchoring is a more effective strategy than A-Anchoring for these question-answering tasks, as evidenced by the significantly higher accuracy achieved by Q-Anchored models. The rapid increase in accuracy within the first few layers for Q-Anchored models indicates that these models quickly learn to extract relevant information from the questions. The lower accuracy of A-Anchored models suggests that they may struggle to effectively utilize the answer information. The similarity in trends between the Llama-3-8B and Llama-3-70B models suggests that the overall architecture and training process are consistent, but the larger model (70B) may have a slightly better ability to maintain accuracy over a larger number of layers. The variance in the data, as indicated by the shaded regions, highlights the inherent uncertainty in these models' performance.