## Line Chart: NDCG@10/% vs. Dimensions
### Overview
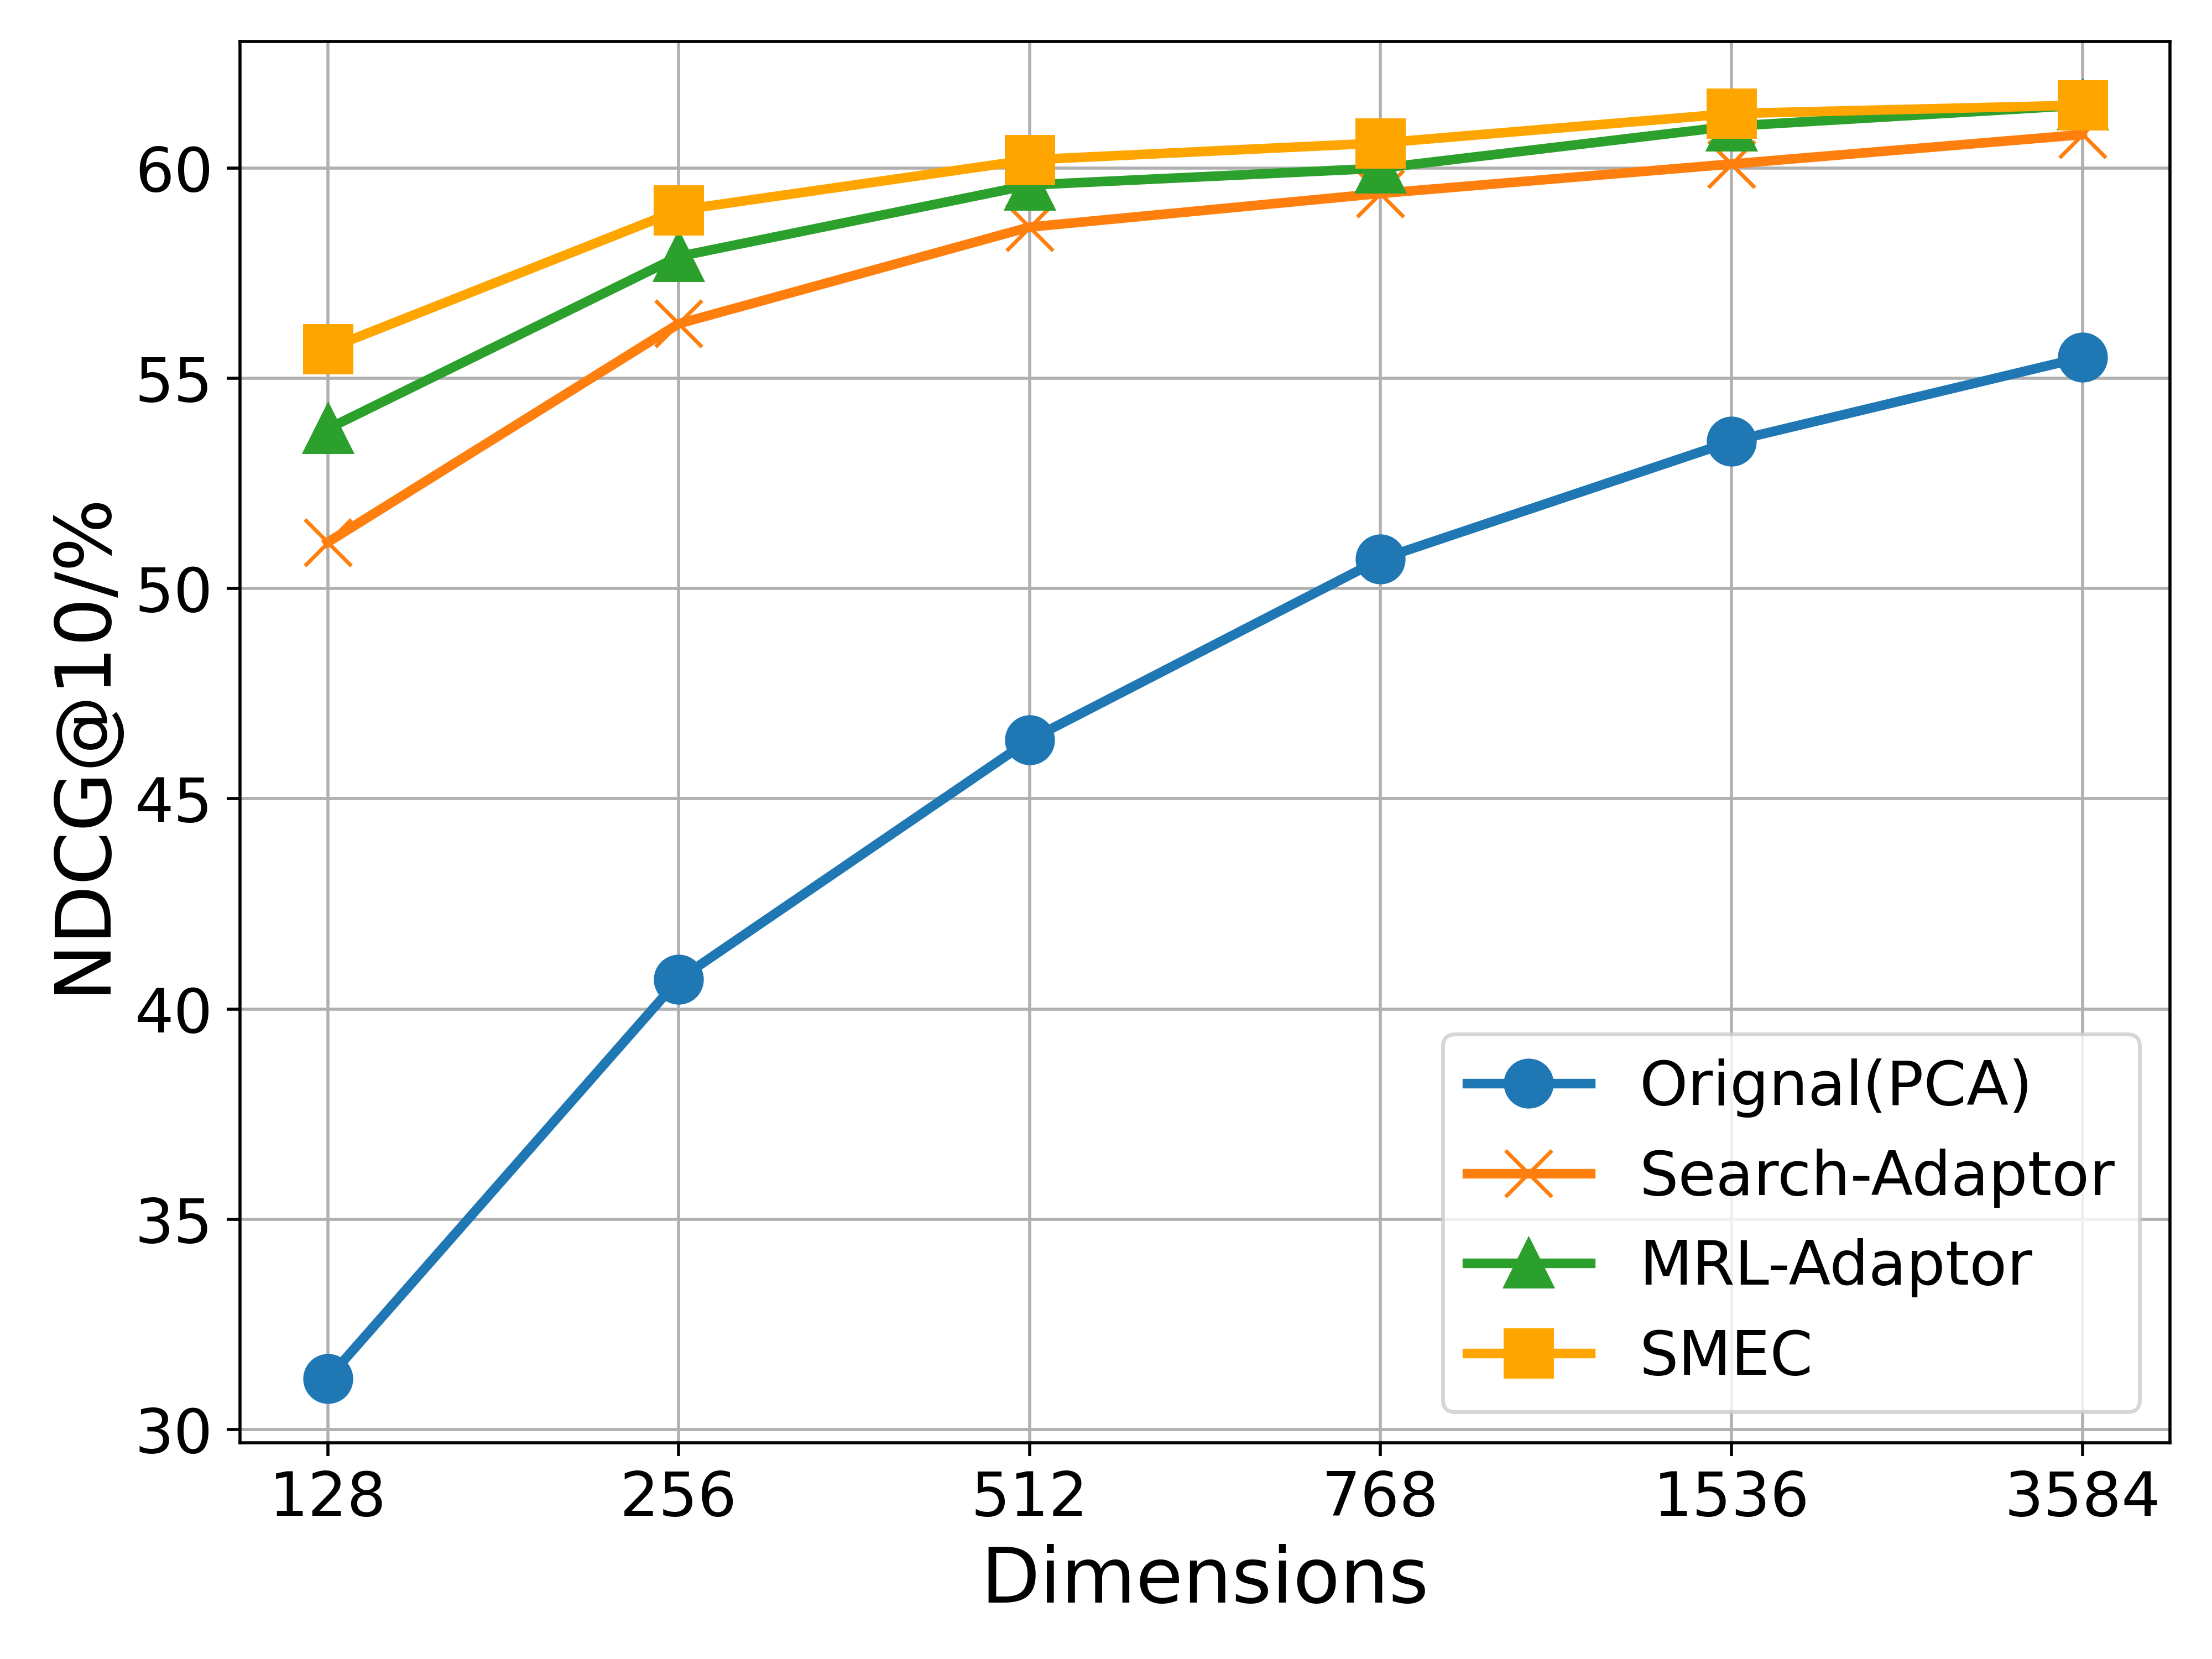
The image is a line chart comparing the performance of four different methods (Original(PCA), Search-Adaptor, MRL-Adaptor, and SMEC) based on the metric NDCG@10/% across varying dimensions. The x-axis represents the number of dimensions, and the y-axis represents the NDCG@10/% score.
### Components/Axes
* **X-axis:** Dimensions, with values 128, 256, 512, 768, 1536, and 3584.
* **Y-axis:** NDCG@10/%, ranging from 30 to 60 with increments of 5.
* **Legend:** Located in the bottom-right corner, it identifies each line by color and method:
* Blue line with circle markers: Original(PCA)
* Orange line with cross markers: Search-Adaptor
* Green line with triangle markers: MRL-Adaptor
* Yellow line with square markers: SMEC
### Detailed Analysis
* **Original(PCA) (Blue):** The line starts at approximately 31 at 128 dimensions and increases steadily to approximately 56 at 3584 dimensions.
* (128, 31)
* (256, 41)
* (512, 46.5)
* (768, 50.5)
* (1536, 53.5)
* (3584, 55.5)
* **Search-Adaptor (Orange):** The line starts at approximately 51 at 128 dimensions, increases to approximately 57 at 256 dimensions, and then gradually increases to approximately 61 at 3584 dimensions.
* (128, 51)
* (256, 57)
* (512, 58.5)
* (768, 59)
* (1536, 60)
* (3584, 61)
* **MRL-Adaptor (Green):** The line starts at approximately 54 at 128 dimensions, increases to approximately 59 at 256 dimensions, and then gradually increases to approximately 61 at 3584 dimensions.
* (128, 54)
* (256, 59)
* (512, 60)
* (768, 60.5)
* (1536, 60.5)
* (3584, 61.5)
* **SMEC (Yellow):** The line starts at approximately 56 at 128 dimensions, increases to approximately 59 at 256 dimensions, and then gradually increases to approximately 61.5 at 3584 dimensions.
* (128, 56)
* (256, 59)
* (512, 60)
* (768, 60.5)
* (1536, 61)
* (3584, 61.5)
### Key Observations
* Original(PCA) has the lowest NDCG@10/% scores across all dimensions compared to the other three methods.
* Search-Adaptor, MRL-Adaptor, and SMEC perform similarly, with SMEC showing a slightly higher NDCG@10/% at higher dimensions.
* The performance of all methods generally improves as the number of dimensions increases, but the rate of improvement decreases at higher dimensions.
### Interpretation
The chart suggests that increasing the number of dimensions generally improves the performance of all methods, as measured by NDCG@10/%. However, the Original(PCA) method consistently underperforms compared to the other three methods. The Search-Adaptor, MRL-Adaptor, and SMEC methods achieve similar performance, with SMEC showing a slight advantage at higher dimensions. This indicates that these methods are more effective at capturing relevant information as the dimensionality increases, while Original(PCA) may be limited by its dimensionality reduction approach. The diminishing returns observed at higher dimensions suggest that there may be a point beyond which increasing dimensionality provides little additional benefit.