## Line Chart: Function Calls vs. Tasks Grouped by Number of Failed LLMs
### Overview
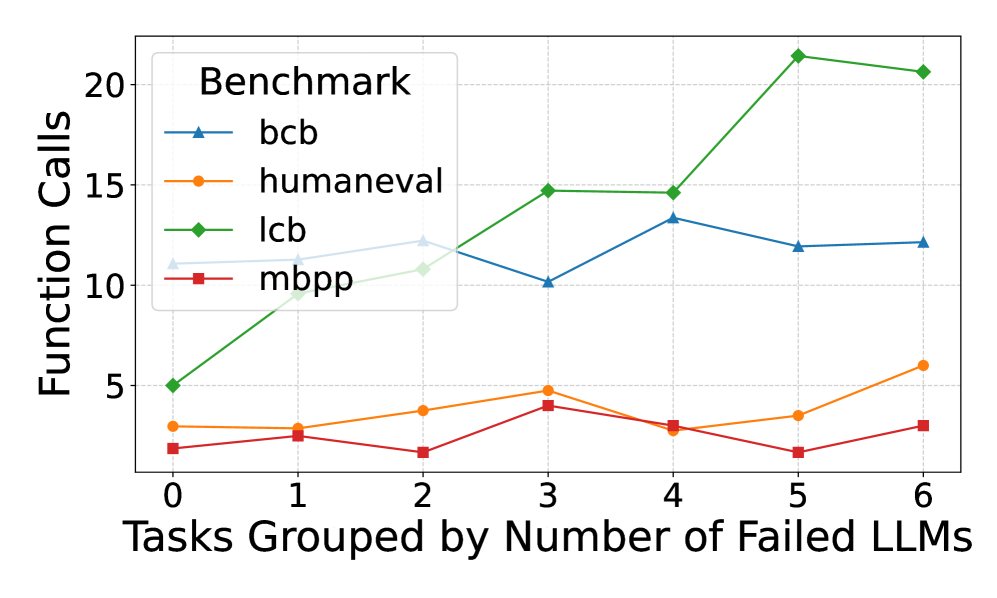
This is a line chart comparing the number of function calls required by four different benchmarks (`bcb`, `humaneval`, `lcb`, `mbpp`) as tasks are grouped by the number of Large Language Models (LLMs) that failed on them. The chart plots the relationship between task difficulty (in terms of LLM failure count) and the computational effort (function calls) for each benchmark.
### Components/Axes
* **X-Axis:** Labeled "Tasks Grouped by Number of Failed LLMs". It has discrete integer markers from 0 to 6.
* **Y-Axis:** Labeled "Function Calls". It has a linear scale with major gridlines and labels at 0, 5, 10, 15, and 20.
* **Legend:** Located in the top-left corner of the chart area, titled "Benchmark". It contains four entries:
* `bcb`: Blue line with upward-pointing triangle markers.
* `humaneval`: Orange line with circle markers.
* `lcb`: Green line with diamond markers.
* `mbpp`: Red line with square markers.
### Detailed Analysis
Data points are approximate values read from the chart's gridlines.
**1. `bcb` (Blue line, triangle markers):**
* **Trend:** Relatively stable, hovering between 10 and 13 function calls, with a notable dip at x=3.
* **Data Points:**
* x=0: ~11
* x=1: ~12
* x=2: ~12
* x=3: ~10
* x=4: ~13
* x=5: ~12
* x=6: ~12
**2. `humaneval` (Orange line, circle markers):**
* **Trend:** Shows a slight, gradual upward trend from left to right, with a dip at x=4.
* **Data Points:**
* x=0: ~3
* x=1: ~3
* x=2: ~4
* x=3: ~5
* x=4: ~3
* x=5: ~4
* x=6: ~6
**3. `lcb` (Green line, diamond markers):**
* **Trend:** Exhibits a strong, consistent upward trend. The slope increases significantly after x=4, reaching the highest values on the chart.
* **Data Points:**
* x=0: ~5
* x=1: ~10
* x=2: ~11
* x=3: ~15
* x=4: ~15
* x=5: ~21
* x=6: ~21
**4. `mbpp` (Red line, square markers):**
* **Trend:** Remains relatively flat and low, fluctuating between 2 and 4 function calls with no strong directional trend.
* **Data Points:**
* x=0: ~2
* x=1: ~3
* x=2: ~2
* x=3: ~4
* x=4: ~3
* x=5: ~2
* x=6: ~3
### Key Observations
1. **Divergent Scaling:** The benchmarks show dramatically different scaling behavior. `lcb` scales poorly (requires many more function calls) as task difficulty increases, while `mbpp` scales very well (requires few additional calls).
2. **Performance Gap:** At the highest difficulty level (x=5,6), the gap between the most resource-intensive (`lcb` at ~21 calls) and the least (`mbpp` at ~3 calls) is enormous—approximately a 7x difference.
3. **Stability vs. Volatility:** `bcb` and `mbpp` show relatively stable call counts across difficulty levels. `humaneval` shows moderate growth, and `lcb` shows high volatility and growth.
4. **Anomaly at x=3:** There is a notable dip for `bcb` at x=3, while `lcb` and `mbpp` show a local peak at the same point. This suggests tasks where 3 LLMs failed might have a unique characteristic affecting these benchmarks differently.
### Interpretation
This chart likely evaluates the efficiency or computational cost of different code generation or evaluation benchmarks (`bcb`, `humaneval`, `lcb`, `mbpp`) in relation to task difficulty. The "Number of Failed LLMs" serves as a proxy for task hardness.
The data suggests that the `lcb` benchmark is particularly sensitive to task difficulty, requiring exponentially more function calls as tasks become harder (as measured by more LLM failures). This could indicate that `lcb` involves more complex validation, deeper search, or more iterative testing. In contrast, `mbpp` appears to be a very lightweight benchmark whose computational cost is largely independent of task difficulty.
The `bcb` benchmark occupies a middle ground, being moderately affected by difficulty but showing a curious resilience or different behavior at the x=3 difficulty level. The `humaneval` benchmark shows a predictable, moderate increase in cost with difficulty.
For a practitioner, this implies that choosing a benchmark involves a trade-off: `lcb` may provide a more rigorous or thorough evaluation for hard tasks but at a high computational cost, while `mbpp` offers a fast, consistent evaluation regardless of difficulty. The choice depends on whether the goal is deep analysis or rapid, scalable assessment.