## Chart Type: Heatmap of Performance Metrics
### Overview
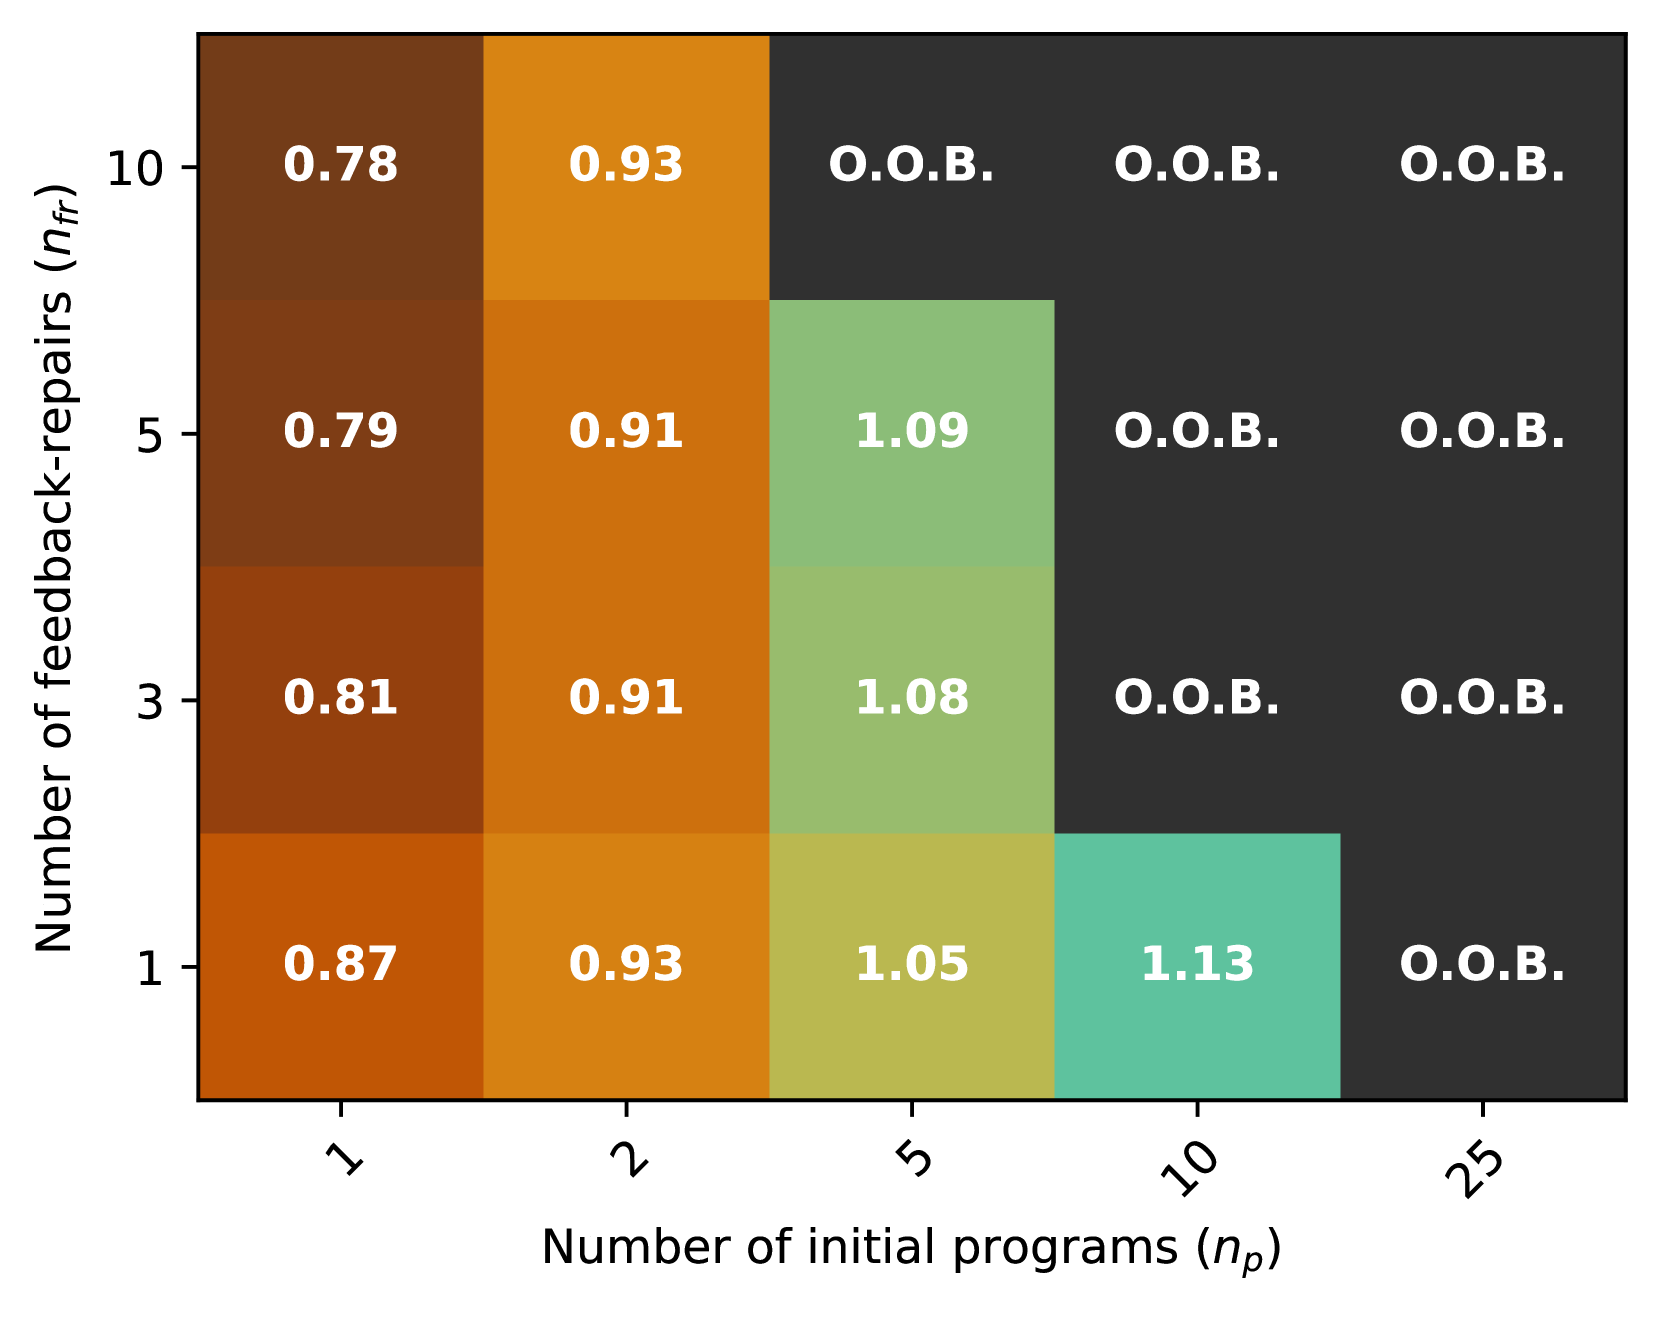
This image displays a heatmap illustrating performance metrics across varying numbers of "feedback-repairs" ($n_{fr}$) and "initial programs" ($n_p$). The heatmap uses a color gradient to represent numerical values, with darker browns/oranges indicating lower values and lighter greens/teals indicating higher values. A distinct dark grey color signifies "O.O.B." (Out Of Bounds or Out Of Budget) where data is not available or applicable.
### Components/Axes
The chart consists of a central grid representing the data, bounded by a Y-axis on the left and an X-axis at the bottom.
* **Y-axis (Left)**:
* **Title**: "Number of feedback-repairs ($n_{fr}$)"
* **Tick Markers**: 10, 5, 3, 1 (ordered from top to bottom, indicating decreasing values).
* **X-axis (Bottom)**:
* **Title**: "Number of initial programs ($n_p$)"
* **Tick Markers**: 1, 2, 5, 10, 25 (ordered from left to right, indicating increasing values).
* **Legend**: No explicit legend is provided. The color mapping is inferred from the values within the cells:
* Dark brown: Values around 0.78 - 0.81
* Orange-brown: Values around 0.87
* Orange: Values around 0.91 - 0.93
* Yellow-green: Values around 1.05
* Light green: Values around 1.08 - 1.09
* Teal: Values around 1.13
* Dark grey: "O.O.B."
### Detailed Analysis
The heatmap presents a 4x5 grid of values, corresponding to the combinations of $n_{fr}$ and $n_p$.
The data can be structured as follows:
| $n_{fr}$ \ $n_p$ | 1 | 2 | 5 | 10 | 25 |
| :--------------- | :------- | :------- | :------- | :------- | :------- |
| **10** | 0.78 | 0.93 | O.O.B. | O.O.B. | O.O.B. |
| **5** | 0.79 | 0.91 | 1.09 | O.O.B. | O.O.B. |
| **3** | 0.81 | 0.91 | 1.08 | O.O.B. | O.O.B. |
| **1** | 0.87 | 0.93 | 1.05 | 1.13 | O.O.B. |
### Key Observations
1. **"O.O.B." Dominance**: A significant portion of the heatmap, particularly towards higher values of $n_p$ and higher values of $n_{fr}$, is marked as "O.O.B.". This indicates that data is not available or the conditions are out of scope for these parameter combinations. Specifically, for $n_p=25$, all $n_{fr}$ values result in "O.O.B.". For $n_p=10$, only $n_{fr}=1$ yields a numerical value (1.13). For $n_p=5$, $n_{fr}=10$ is "O.O.B.".
2. **General Trend with $n_p$**: For a fixed number of feedback-repairs ($n_{fr}$), as the number of initial programs ($n_p$) increases, the performance metric generally tends to increase before hitting the "O.O.B." region. For example, at $n_{fr}=1$, the values are 0.87 ($n_p=1$), 0.93 ($n_p=2$), 1.05 ($n_p=5$), and 1.13 ($n_p=10$).
3. **General Trend with $n_{fr}$**: For a fixed number of initial programs ($n_p$), as the number of feedback-repairs ($n_{fr}$) decreases (moving down the Y-axis):
* At $n_p=1$, the values increase from 0.78 ($n_{fr}=10$) to 0.87 ($n_{fr}=1$).
* At $n_p=2$, the values are relatively stable, fluctuating slightly around 0.91-0.93.
* At $n_p=5$, the values decrease from 1.09 ($n_{fr}=5$) to 1.05 ($n_{fr}=1$), after being "O.O.B." at $n_{fr}=10$.
4. **Highest Value**: The highest observed numerical value is 1.13, occurring at $n_{fr}=1$ and $n_p=10$. This cell is colored teal.
5. **Lowest Value**: The lowest observed numerical value is 0.78, occurring at $n_{fr}=10$ and $n_p=1$. This cell is colored dark brown.
6. **Color Gradient Consistency**: The color gradient consistently maps lower numerical values to darker brown/orange hues and higher numerical values to lighter green/teal hues, with "O.O.B." being distinctly dark grey.
### Interpretation
The heatmap suggests that the performance metric is influenced by both the number of feedback-repairs ($n_{fr}$) and the number of initial programs ($n_p$).
The "O.O.B." regions are critical. They imply that certain combinations of parameters are either not feasible, not tested, or fall outside the defined operational boundaries of the system being evaluated. Specifically, a high number of initial programs ($n_p=25$) consistently leads to "O.O.B." regardless of feedback-repairs, suggesting a potential limitation or inefficiency at that scale. Similarly, a high number of feedback-repairs ($n_{fr}=10$) combined with a moderate to high number of initial programs ($n_p \ge 5$) also results in "O.O.B.".
Within the observable range, there's a general trend where increasing the number of initial programs ($n_p$) tends to improve the performance metric, especially when the number of feedback-repairs ($n_{fr}$) is low. The peak performance (1.13) is achieved with a low number of feedback-repairs ($n_{fr}=1$) and a relatively high number of initial programs ($n_p=10$).
Conversely, for a fixed low number of initial programs ($n_p=1$), reducing feedback-repairs ($n_{fr}$) seems to slightly increase the metric. However, for $n_p=2$, the metric remains relatively stable across different $n_{fr}$ values. For $n_p=5$, reducing $n_{fr}$ from 5 to 1 leads to a slight decrease in the metric (1.09 to 1.05).
This data could indicate that:
* There's an optimal balance between $n_{fr}$ and $n_p$ for maximizing the performance metric, which appears to be around $n_{fr}=1$ and $n_p=10$.
* Excessive initial programs ($n_p=25$) or certain combinations involving higher $n_{fr}$ and $n_p$ are not viable or lead to system failures/unmeasurable states ("O.O.B.").
* The impact of $n_{fr}$ on performance is less straightforward and depends on the value of $n_p$. For low $n_p$, lower $n_{fr}$ is better; for moderate $n_p$, $n_{fr}$ has less impact; and for higher $n_p$, only very low $n_{fr}$ values yield results.
Further investigation into the meaning of "O.O.B." and the nature of the performance metric would provide deeper insights into the system's behavior and limitations.