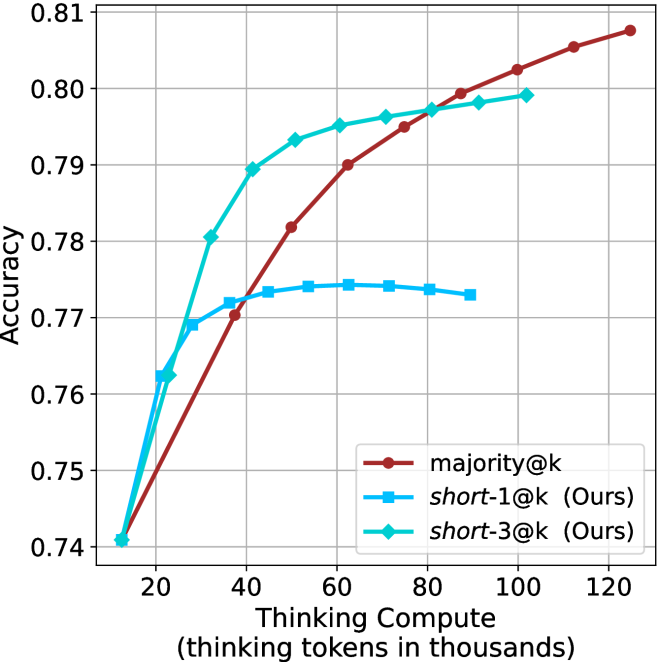
## Line Chart: Accuracy vs. Thinking Compute
### Overview
The image is a line chart comparing the accuracy of three different models ("majority@k", "short-1@k (Ours)", and "short-3@k (Ours)") as a function of "Thinking Compute" (measured in thousands of thinking tokens). The chart displays accuracy on the y-axis, ranging from 0.74 to 0.81, and thinking compute on the x-axis, ranging from 20,000 to 120,000 tokens.
### Components/Axes
* **X-axis:** "Thinking Compute (thinking tokens in thousands)". The axis ranges from 20 to 120 in increments of 20.
* **Y-axis:** "Accuracy". The axis ranges from 0.74 to 0.81 in increments of 0.01.
* **Legend:** Located in the bottom-right corner of the chart.
* **Brown line with circle markers:** "majority@k"
* **Light blue line with square markers:** "short-1@k (Ours)"
* **Teal line with diamond markers:** "short-3@k (Ours)"
### Detailed Analysis
* **majority@k (Brown line with circle markers):**
* Trend: The line generally slopes upward, indicating increasing accuracy with increasing thinking compute.
* Data Points:
* (20, 0.74)
* (40, 0.77)
* (60, 0.788)
* (80, 0.798)
* (100, 0.805)
* (120, 0.809)
* **short-1@k (Ours) (Light blue line with square markers):**
* Trend: The line increases initially, plateaus, and then slightly decreases.
* Data Points:
* (20, 0.74)
* (40, 0.772)
* (60, 0.774)
* (80, 0.774)
* (100, 0.772)
* **short-3@k (Ours) (Teal line with diamond markers):**
* Trend: The line increases and then plateaus.
* Data Points:
* (20, 0.74)
* (40, 0.78)
* (60, 0.794)
* (80, 0.796)
* (100, 0.799)
### Key Observations
* All three models start with the same accuracy at a thinking compute of 20,000 tokens (0.74).
* The "majority@k" model consistently increases in accuracy as thinking compute increases.
* The "short-1@k (Ours)" model plateaus and slightly decreases after a certain point.
* The "short-3@k (Ours)" model plateaus after an initial increase.
* The "majority@k" model has the highest accuracy at the highest thinking compute (120,000 tokens).
### Interpretation
The chart compares the performance of three different models as a function of thinking compute. The "majority@k" model appears to benefit most from increased thinking compute, as its accuracy consistently increases. The "short-1@k (Ours)" and "short-3@k (Ours)" models show diminishing returns, with accuracy plateauing or even decreasing after a certain point. This suggests that the "majority@k" model may be more efficient or better suited for higher levels of thinking compute compared to the other two models. The "short-3@k (Ours)" model performs better than "short-1@k (Ours)" overall.